4.
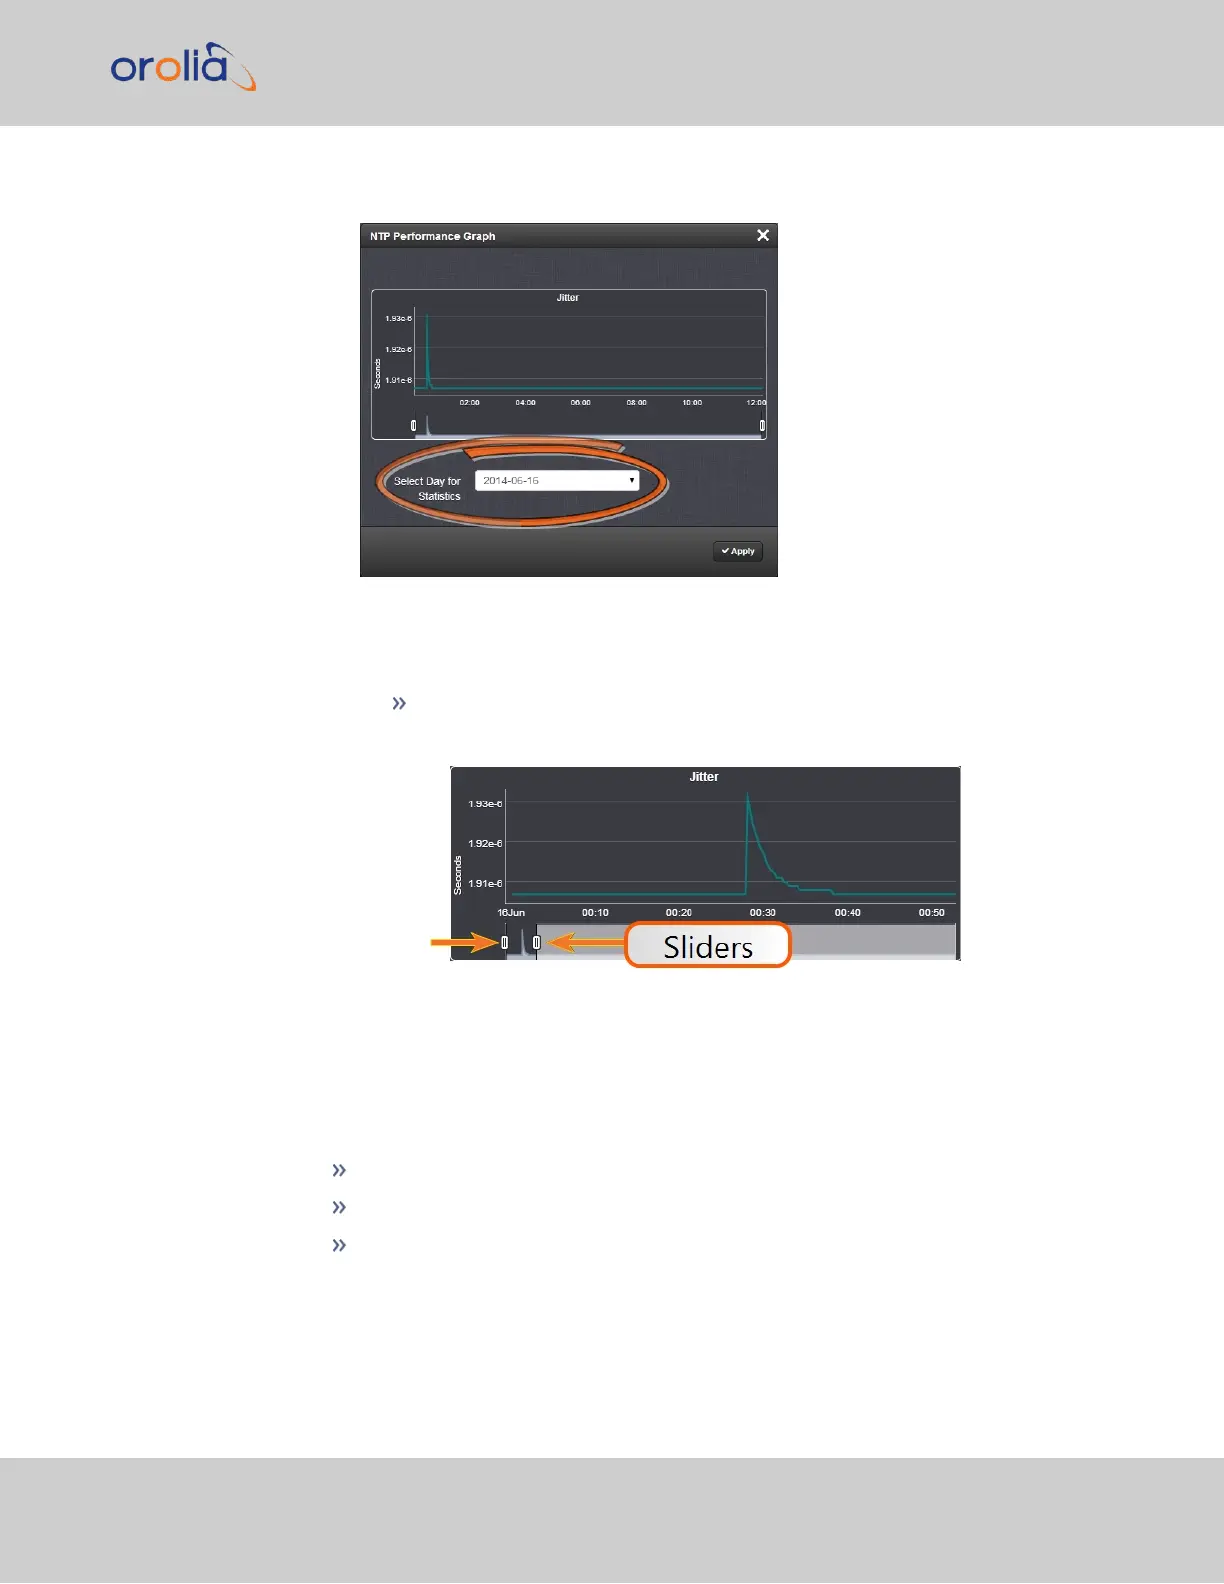
The NTP Performance Graph panel will appear.
5.
To select the statistics for a particular day, select a date from the drop-down list in
the Select Day for Statistics field. The default date is the present date. Click the
Apply button.
To display a higher resolution graph for a shorter time span, move one or both
time sliders at the bottom of the graph inwards.
4.5.1.10 Temperature Management
SecureSync is equipped with one cooling fan, located behind the right-hand side of the
front panel, and several hardware temperature sensors, including:
the board temperature near the CPU
the CPU temperature
the air temperature near the oscillator.
Temperature readings are performed once per minute. The temperature data is logged,
and can be visualized via graphs integrated into the WebUI. The temperature readings can
also be used to control the fan. For details see below under Fan Control Feature.
4.5 Quality Management
CHAPTER 4 • SecureSync 2400 User Manual Rev. 2
299