Temperature Monitoring
You can monitor the unit's measured temperatures actively by inspecting the temperature
graphs in the Web UI, or passively by setting up automatic alarm messages.
Alarm notifications can be generated via SNMP Traps and Emails, as well as log messages
in the Alarm and Event Logs. The alarms may optionally be masked.
Also, it is possible to implement a delay by setting the number of times the 1/minute read-
ings need to exceed a temperature threshold before an alarm is triggered.
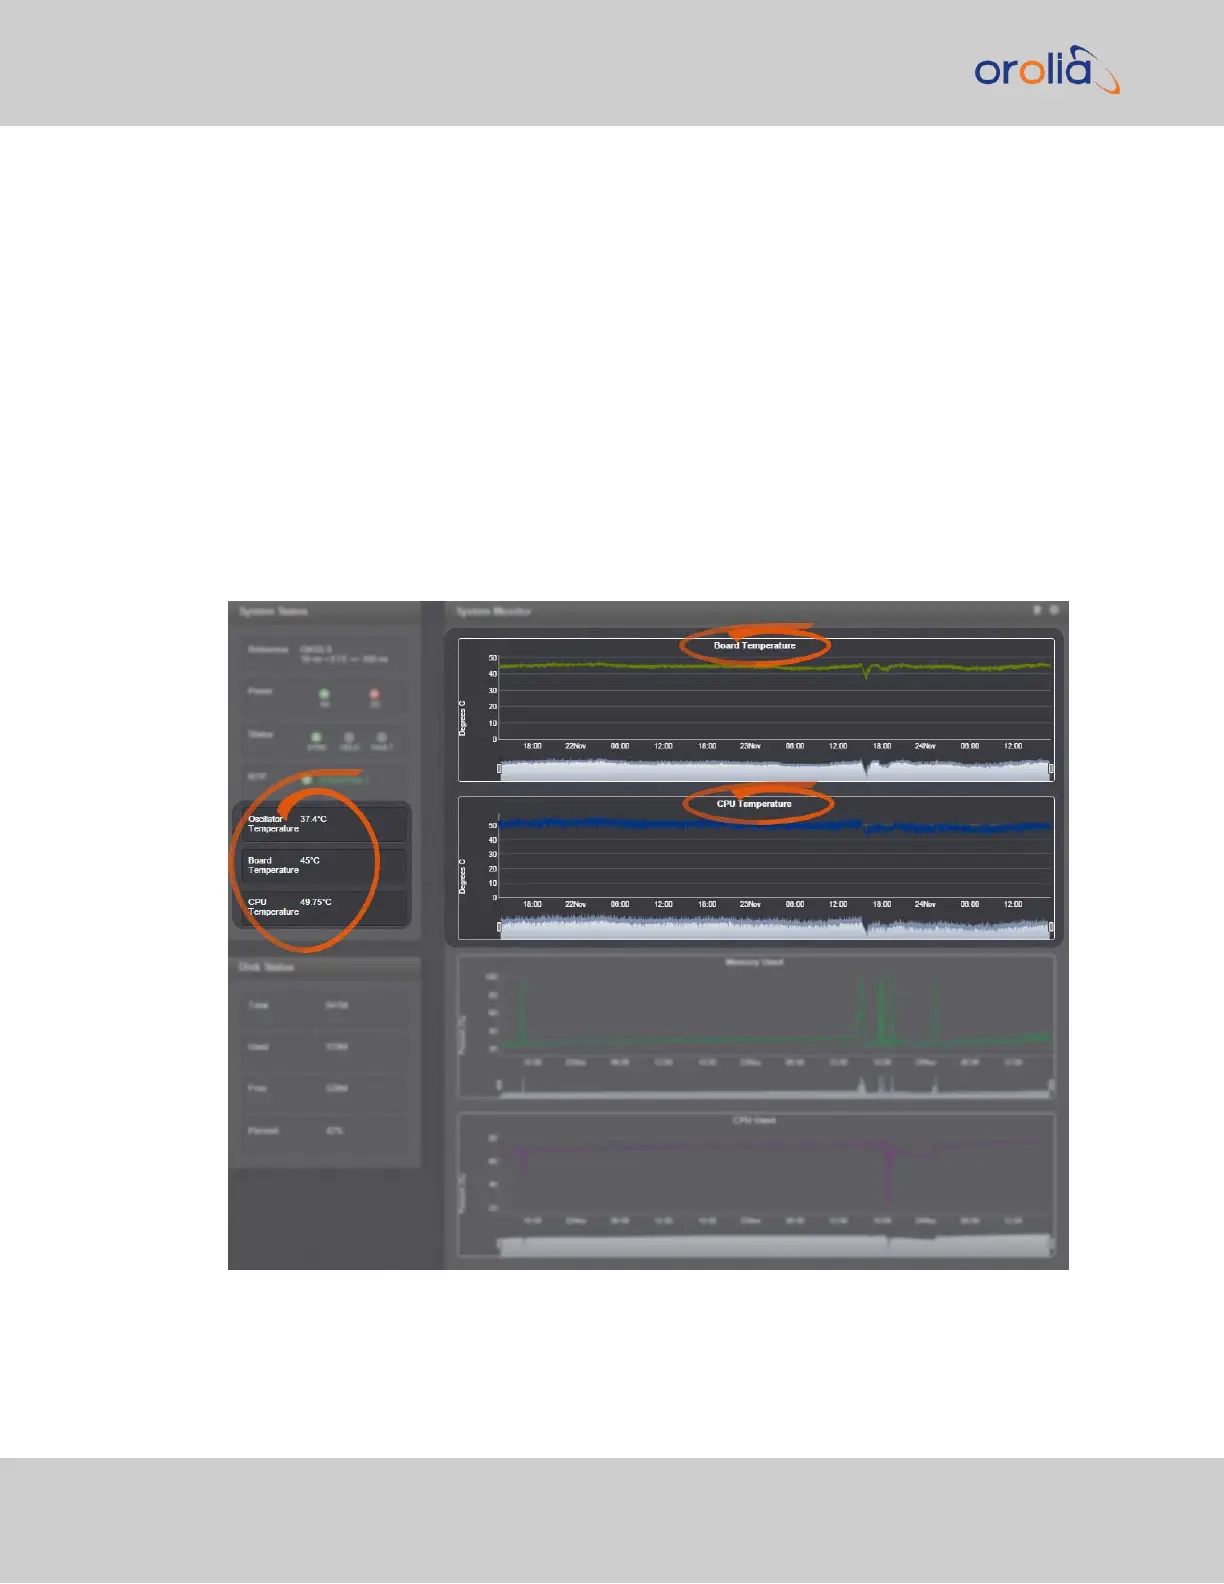
Monitoring CPU and Board Temperature
Current readings for Oscillator/Board/CPU Temperature are displayed in the System
Status panel, which can be accessed via the HOME screen, or via TOOLS > System Mon-
itor.
CPU and Board Temperature graphs are displayed under TOOLS > System Monitor:
The graph for the Oscillator Temperature is displayed under MANAGEMENT > OTHER:
Disciplining:
300
CHAPTER 4 • SecureSync 2400 User Manual Rev. 2
4.5 Quality Management