Event log display
functions
View all: Shows a graph area with a width as the duration of the test.
Custom: This is automatically selected when the graph area is touch-
manipulated.
Max pointer value
Used to set the y-scaling of the view. The maximum amplitude of the plot
always originates from the zero line.
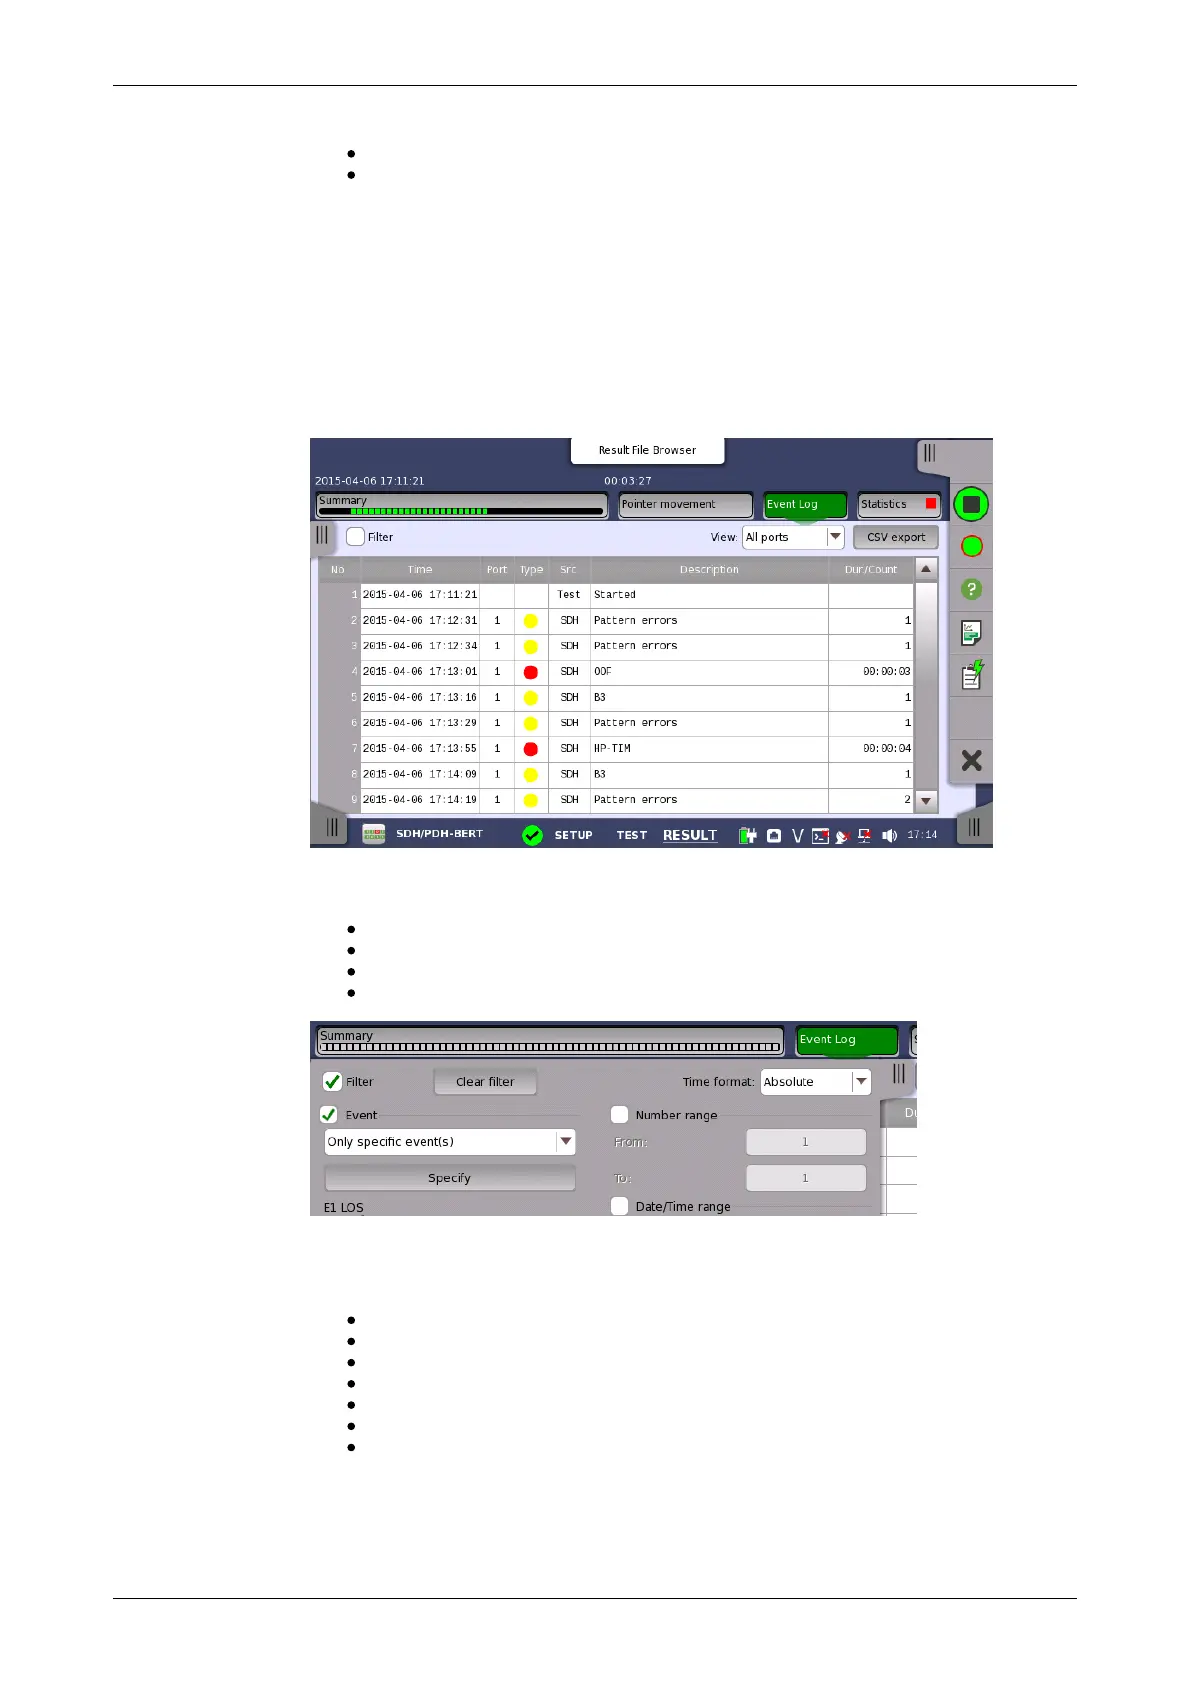
5.9.3.3 Event Log
Touching the Event Log button in the navigation area displays the screen
shown below.
The slide-out panel on the left-hand side of the screen contains the following
event log functions:
Define time format.
Enabling event log filter.
Event log filter configuration.
Clear event log filter configuration.
For an event to be displayed, it must pass the Event filter, the Number
range filter and the Date/Time range filter if they are all enabled.
The Event filter has seven filter modes:
Show events from specific sources only.
Do not show events from specific sources.
Show specific events from specific sources only.
Do not show specific events from specific sources.
Show specific types only.
Do not show specific types.
Show events where the source- or the description field matches a user
specified text string only.
Choose the desired event filter mode and touch the Specify button in order
to select the specific sources and events.