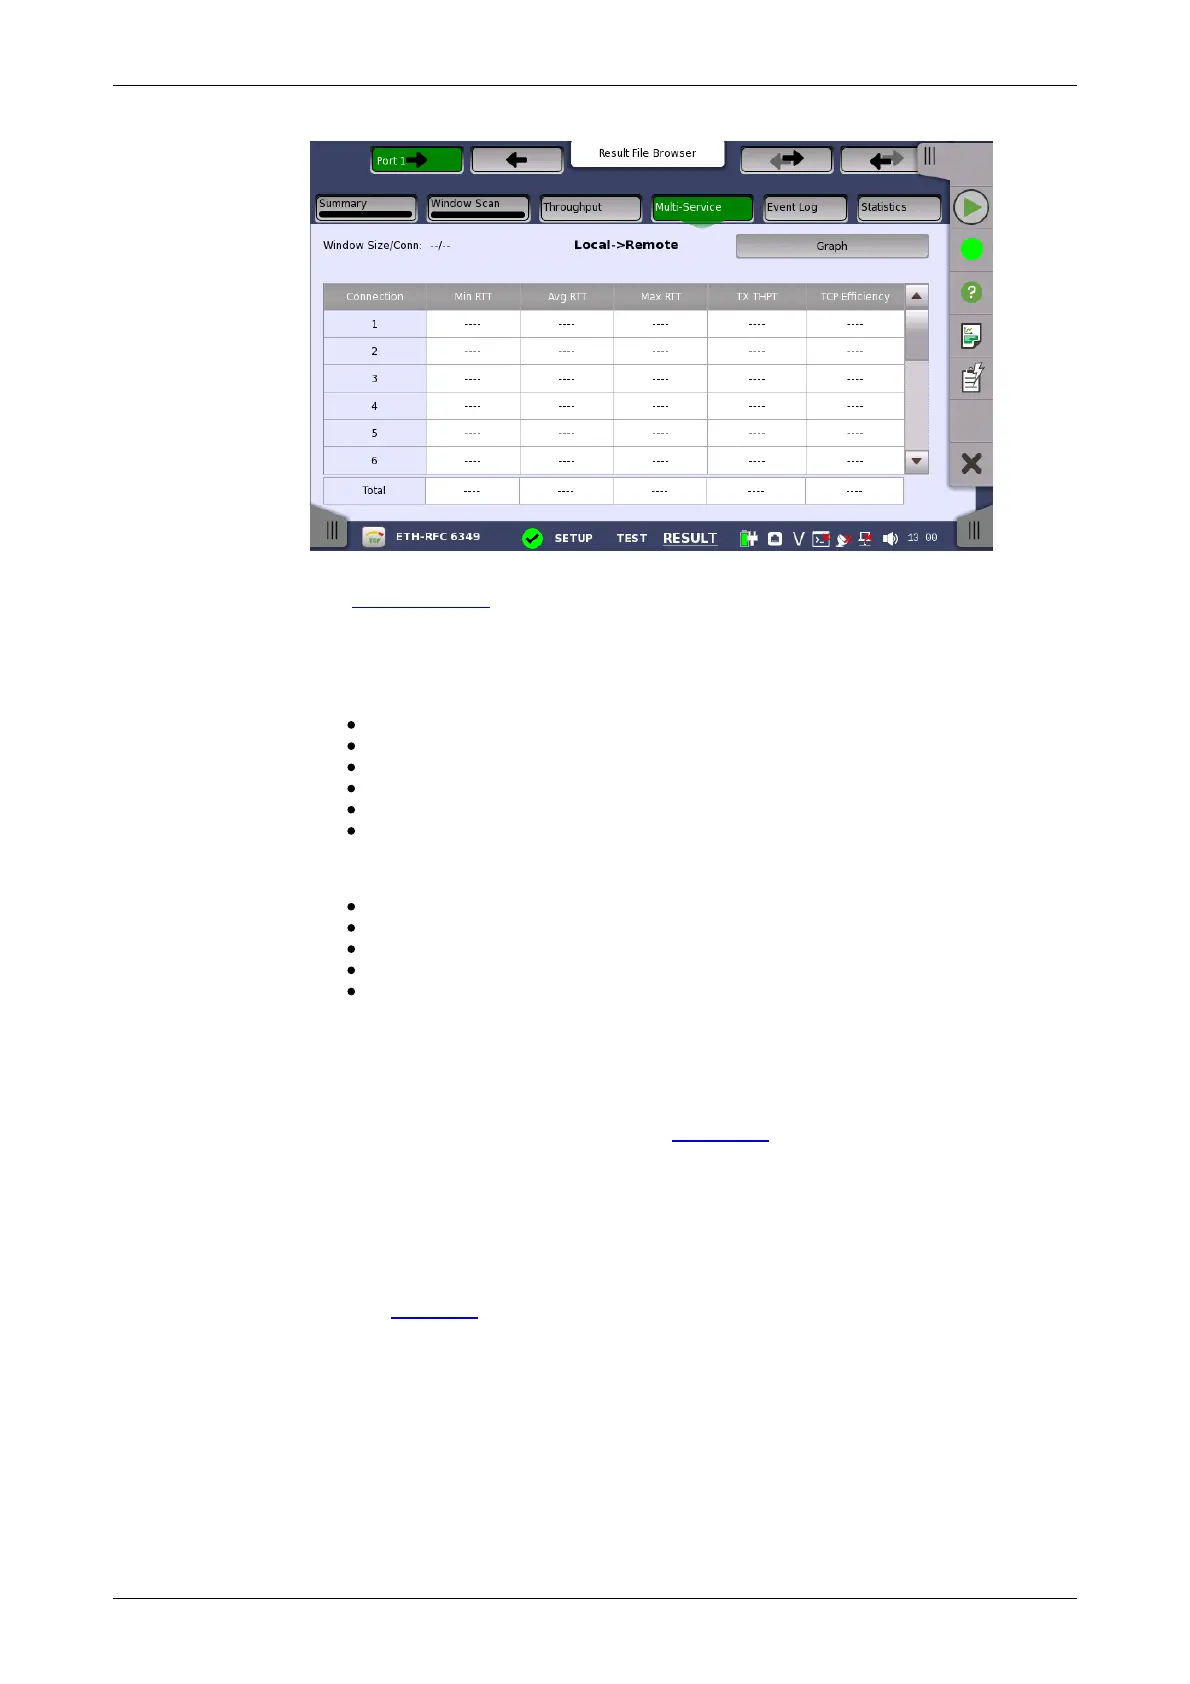
This screen presents results by each TCP connection of RTT, Throughput
and TCP Efficiency. Use the Graph and Table buttons to switch between the
tabular form and a graphical presentation of the results.
Touching the button in navigation area switches the Test direction of results.
The results in Connection are:
Connection: Connection number of the stream
Min RTT: Minimum Round Trip Time
Avg RTT: Average Round Trip Time
Max RTT: Maximum Round Trip Time
Tx THPT: Transmitter throughput
TCP Efficiency: The ratio of actual throughput against ideal throughput
The results in Total are:
Min RTT: Minimum RTT in all connections
Avg RTT: Average Round Trip Time
Max RTT: Maximum RTT in all connections
Tx THPT: Sum of throughput in each connections
TCP Efficiency: The ratio of total actual throughput of connections
against total ideal throughput of connections
6.10.3.6 Event Log
Touching the Event Log button in the navigation area displays the screen
providing the event log data. Refer to Event Log of SDH/SONET/PDH/DSn
BERT application.
6.10.3.7 Statistics
Touching the Statistics button in the navigation area displays the screen
providing the statistics data.
Refer to Statistics of BERT for the operation.
Performance and Frame are displayed as RFC 6349 Statistic result.
6.11 SAT 1564