Graphical
presentation
Graphical
presentation
6.7.3 Test Results
The results of an Ethernet Ping test relate to a specific port and consist of the
Round Trip Times of the ping requests. The data is shown in both list-form
and in a graphical presentation.
The graphical presentation consists of a bar diagram of the Round Trip
Times and of a pie chart showing the percentage distribution of echo replies
and timeouts.
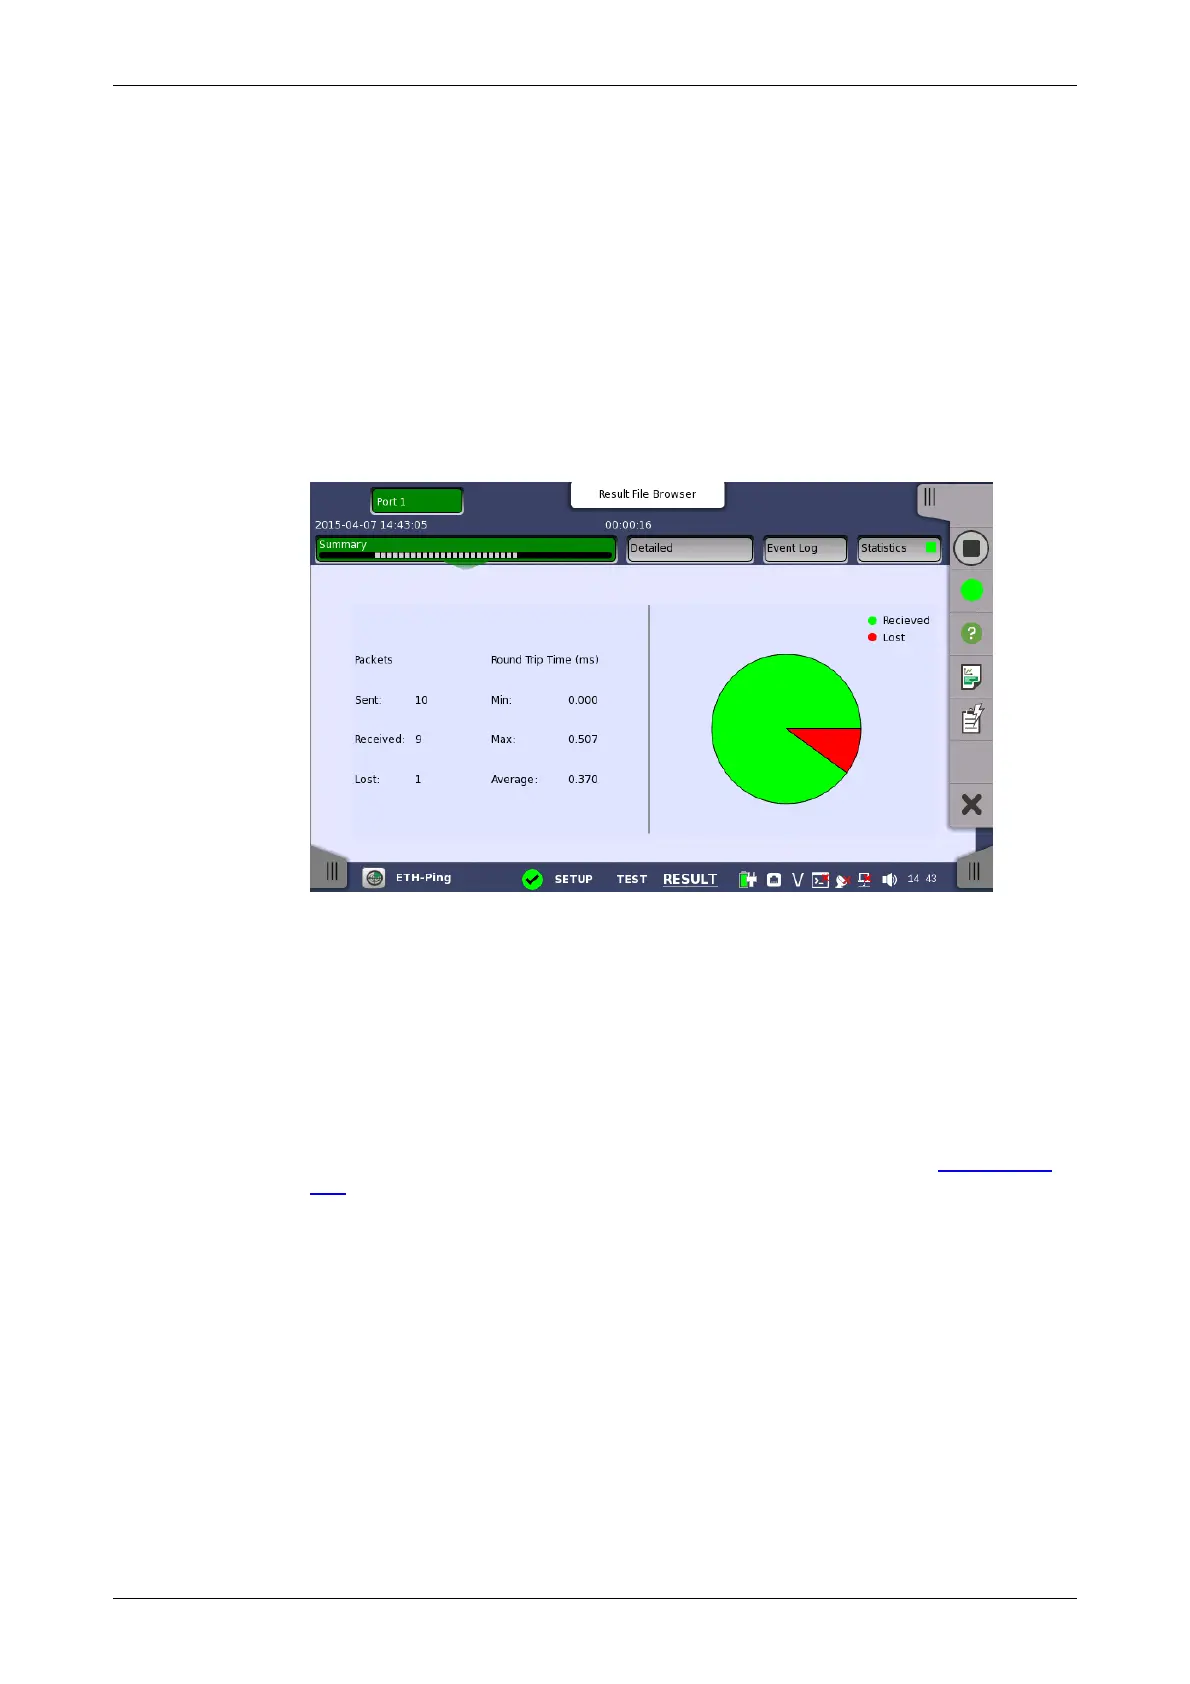
6.7.3.1 Summary
When you go to the test results of the Ethernet Ping test, the following screen
is displayed.
This screen presents a summary of the results of an Ethernet Ping test. The
results relate to a specific port and consist of information about
sent/received/lost packages and the minimum/maximum/average Round
Trip Time.
The graphical presentation consists of a pie chart showing the percentage
distribution of received/lost packages.
6.7.3.2 IEEE1588v2 Log
If Ext. log is selected in IEEE1588v2 screen of Ethernet Frame Setup, the
IEEE1588v2 Log button appears in the navigation area. Refer to IEEE1588v2
Log in "BERT" for the operation.
6.7.3.3 Detailed
Touching the Detailed button in the navigation area will display the following
screen.