This screen presents the results from the Latency test.
The most important columns of the tables are the varied main parameters
Frame size and Throughput and the performance parameters Min, Avg and
Max latency stated in micro seconds.
The order of the tables will vary depending on the test mode and the relation of
the ports. Refer to the table in "Throughput" subsection of "Test Results".
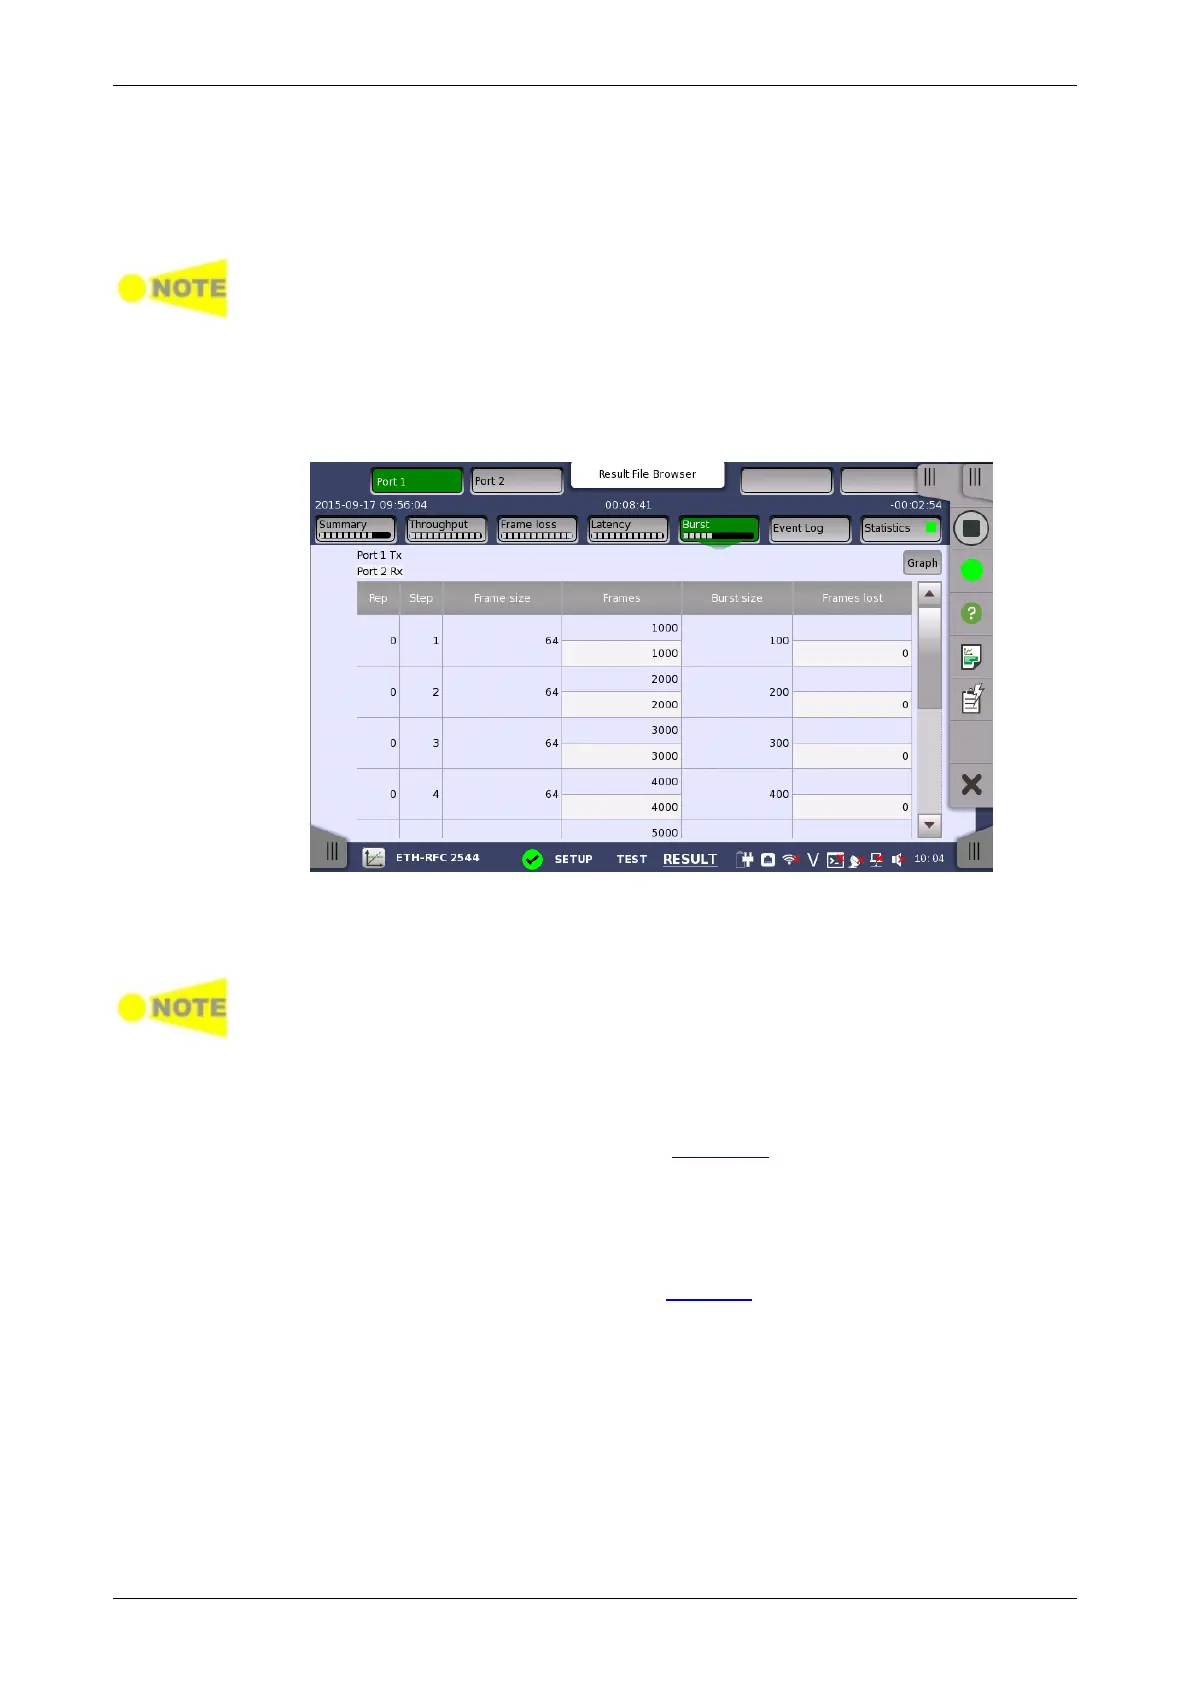
6.9.3.6 Burst
Touching the Burst button in the navigation area will display the screen
shown below.
This screen presents the results from the Burst test.
The most important columns of the tables are the varied main parameters
Burst size and Frame size and the performance parameter Frames lost.
The order of the tables will vary depending on the test mode and the relation of
the ports. Refer to the table in "Throughput" subsection of "Test Results".
6.9.3.7 Event Log
Touching the Event Log button in the navigation area displays the screen
providing the event log data. Refer to Event Log of SDH/SONET/PDH/DSn
BERT application.
6.9.3.8 Statistics
Touching the Statistics button in the navigation area displays the screen
providing the statistics data. Refer to Statistics of BERT for the operation.
6.9.4 Throughput Calculation
Throughput may be calculated on 6 different layers.