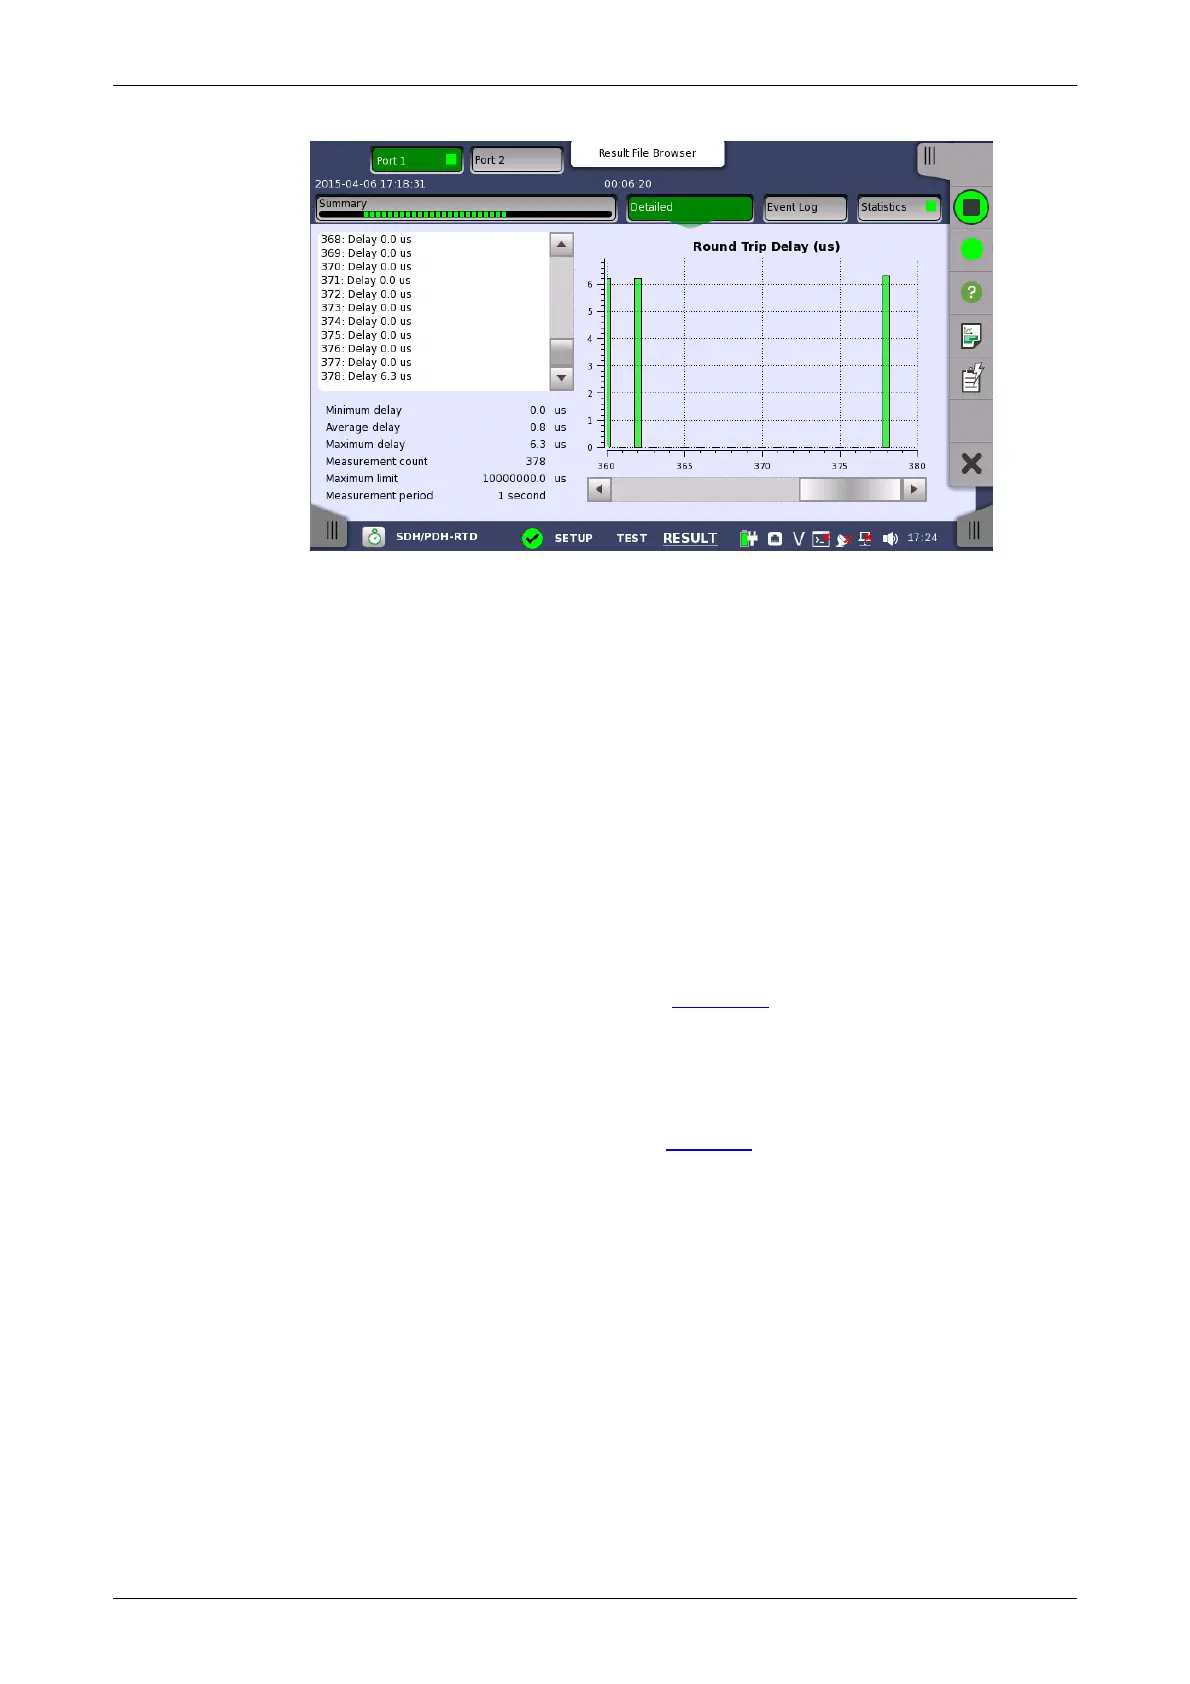
Summary field
List-form
information
Graphical
presentation
Buttons for selecting the relevant port are displayed at the top of the screen,
with a color indication of the pass/fail status of the test.
This screen presents the detailed results of an RTD test. The result is shown
in both list-form and in a graphical presentation. This screen contains the
summary field displayed below the list.
Consists of the minimum, average, and maximum round-trip delay times in
microseconds, the number of measurements, the specified threshold value
and measurement period.
Presents the results of an RTD test in list-form.
The graphical presentation consists of a bar diagram of the round-trip delay
times.
5.10.3.3 Event Log
Touching the Event Log button in the navigation area displays the screen
providing the event log data. Refer to Event Log of SDH/SONET/PDH/DSn
BERT application.
5.10.3.4 Statistics
Touching the Statistics button in the navigation area displays the screen
providing the statistics data. Refer to Statistics of BERT for the operation.