Pattern
Pattern Error
insertion
The three dials showing utilization/throughput results, pattern errors and
errored frames can be enlarged by touching on them. The black needle
points the measured value in the latest period.
Refer to the Summary of BERT in "Ethernet Application".
When Fibre Channel is selected on 'Threshold' of the Test Setup screen,
the Fibre Channel information appears in the upper right-hand corner,
shows pass/fail status summary. Touching the Details button allows you to
inspect the individual pass/fail status.
Select the pattern.
This provides the same Error insertion as Stimuli setup options in
Application Toolbar.
Insertion
If selecting Manual, error(s) are inserted when you touch the Alarm/Error
Insert ( ).
Set Off to stop the error insertion.
Burst length
If 'Insertion' is set to Manual, touch the button and set the number of errors
to insert.
9.2.3.2 Event Log
Touching the Event Log button in the navigation area displays the screen
providing the event log data. Refer to Event Log of SDH/SONET/PDH/DSn
BERT application.
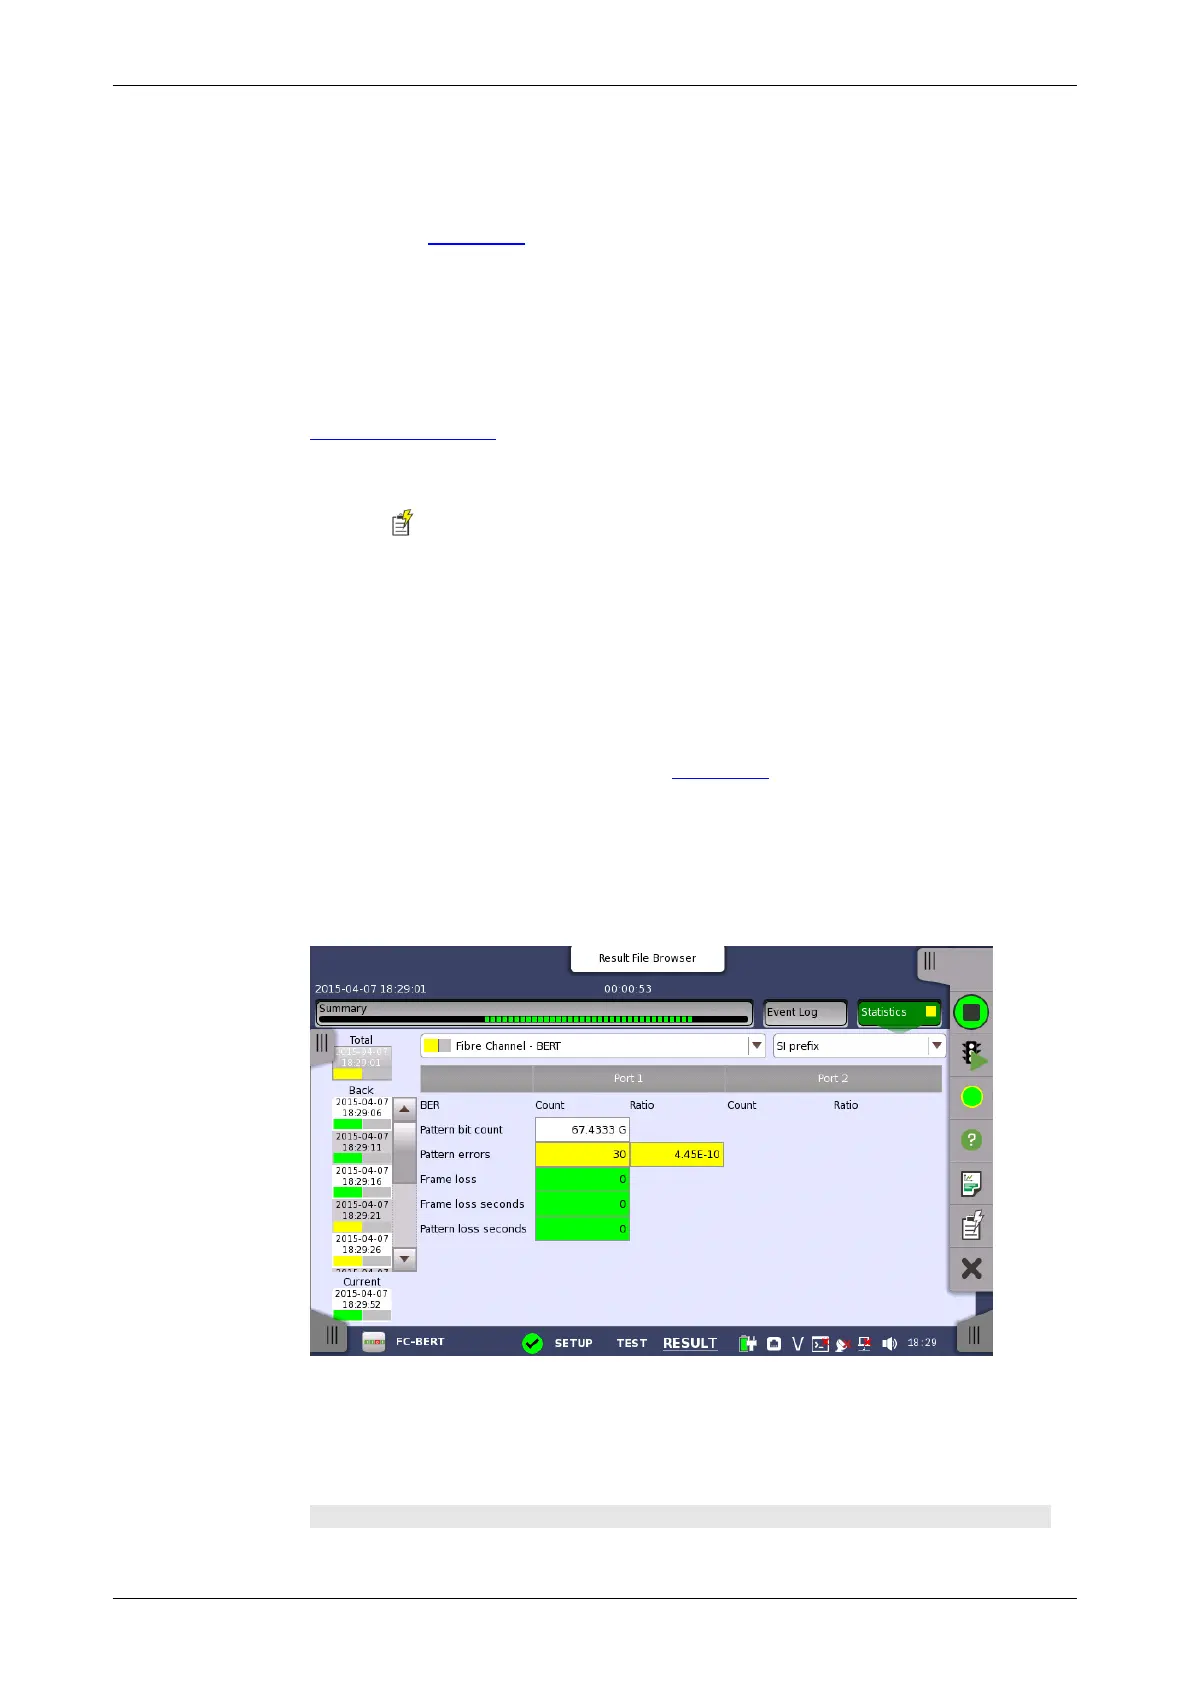
9.2.3.3 Statistics
Touching the Statistics button in the navigation area displays the screen
shown below.
This screen presents a detailed analysis of the test results. You can choose
to view either the results of a specific time interval or the total results from
measurement start. The results can be displayed either in table (list) form or
as graphs. You can also zoom in on a specific result item and display either
a zoom or a histogram.
Selecting which results to view