Interval or total
results
Selecting type of
results
Studying a
specific result
Selecting
notation
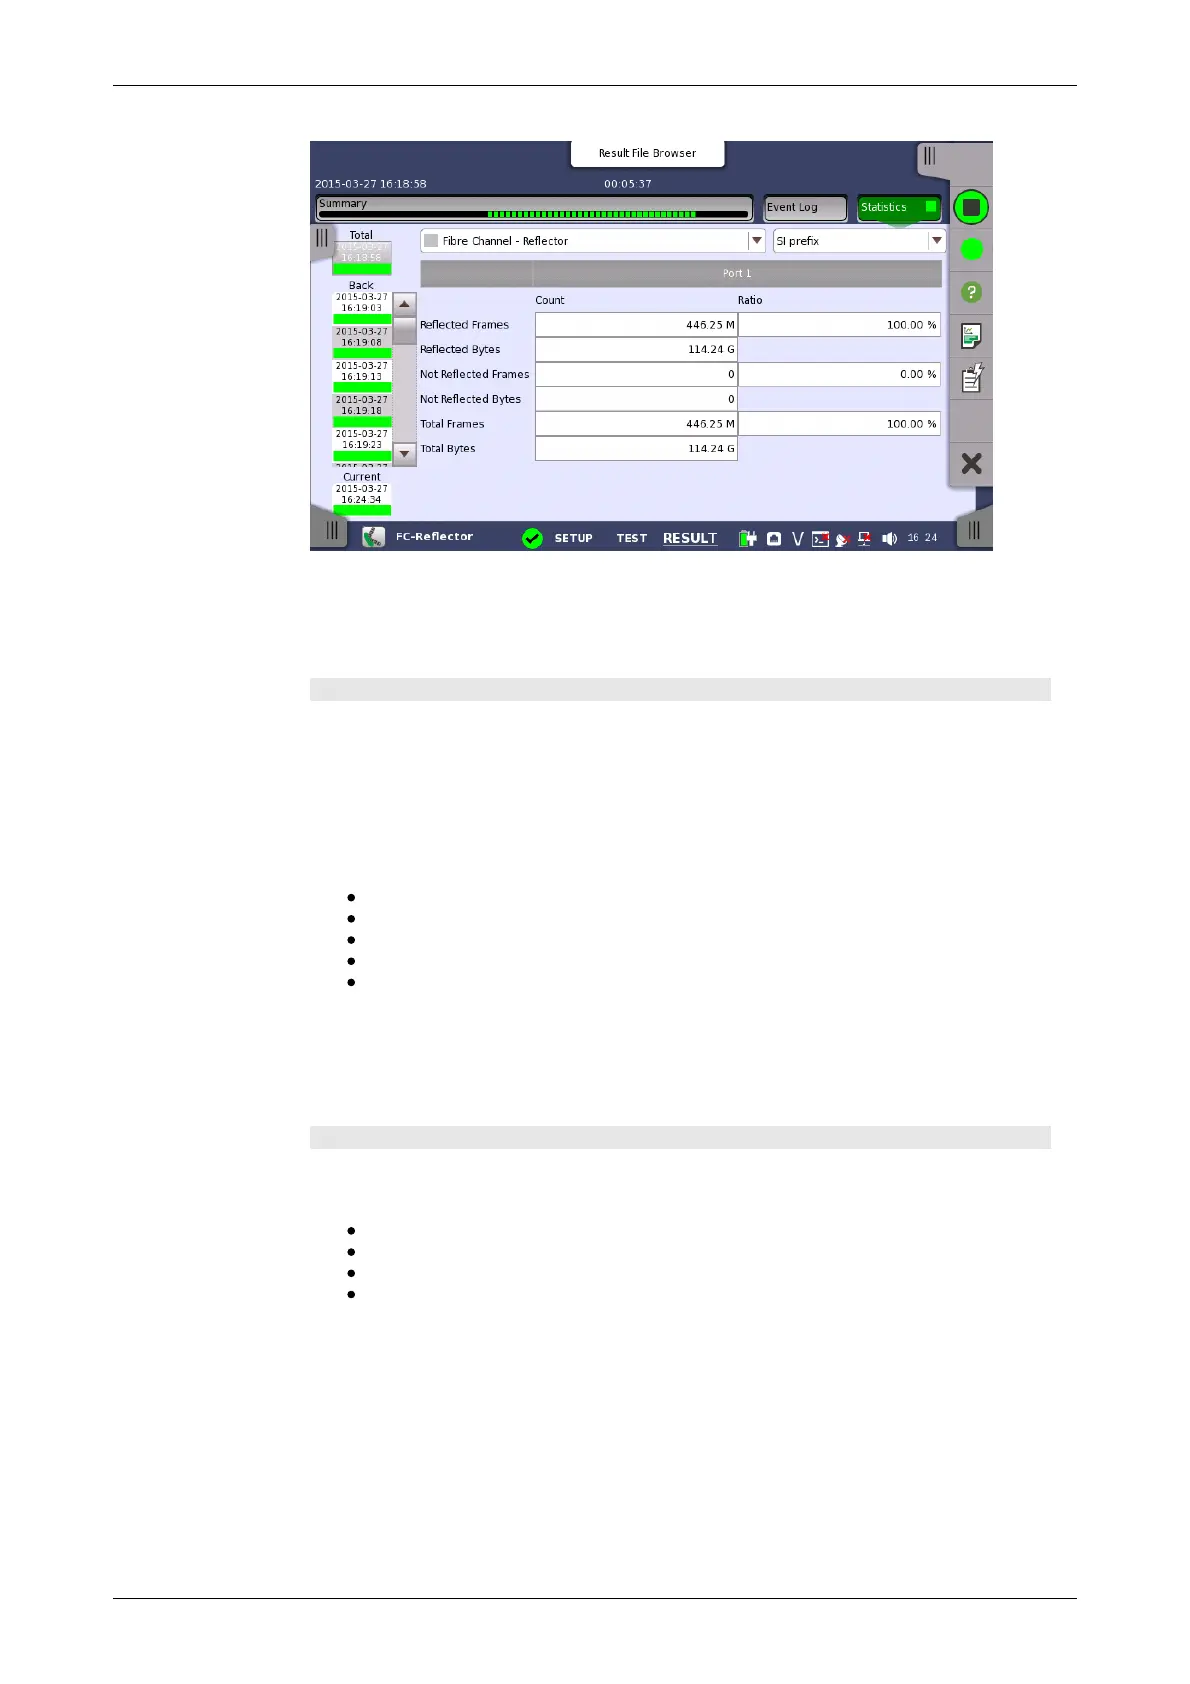
This screen presents a detailed analysis of the test results. You can choose
to view either the total results from measurement start or the results of a
specific interval during the test. You can also zoom in on a specific result
item. The results can be displayed either in table (list) form or as a graph.
Selecting which results to view
Touch the relevant Intervals field to view the count and ratio measured
during the interval.
Touch the Total field to view the total count and total ratio from the
measurement start.
Open the middle drop-down menu in the top row of buttons to select which
results you want displayed on the screen.
Reflector
Link
Frame
Performance
Size Distribution
Touch a specific cell in a result table to zoom in on the corresponding result
item. The Count and Ratio fields are displayed on a Zoom tab page. A
Histogram tab page is also available. Use the Back button to return to the
statistics screen.
Selecting how results are displayed
Select the required notation for the results from the notation drop-down
menu.
Unformatted - e.g. 71892
SI prefix - e.g. 71.892 k (k means "kilo")
Engineering - e.g. 71.892E3
Scientific - e.g. 7.1892E4