Understanding the Appliance Status
TABLE 23
Summary of Main Memory Usage
Summary of main memory (RAM) usage
Cache Bytes in use by the filesystem cache to improve
performance.
Unused Bytes not currently in use. After booting, this value will
decrease as space is used by the filesystem cache.
Mgmt Bytes in use by the appliance management software.
Other Bytes in use by miscellaneous operating system software.
Kernel Bytes in use by the operating system kernel.
Note that users need the analytics/component create+read authorization to view the
memory usage. Without this authorization, the memory details do not appear on the Dashboard.
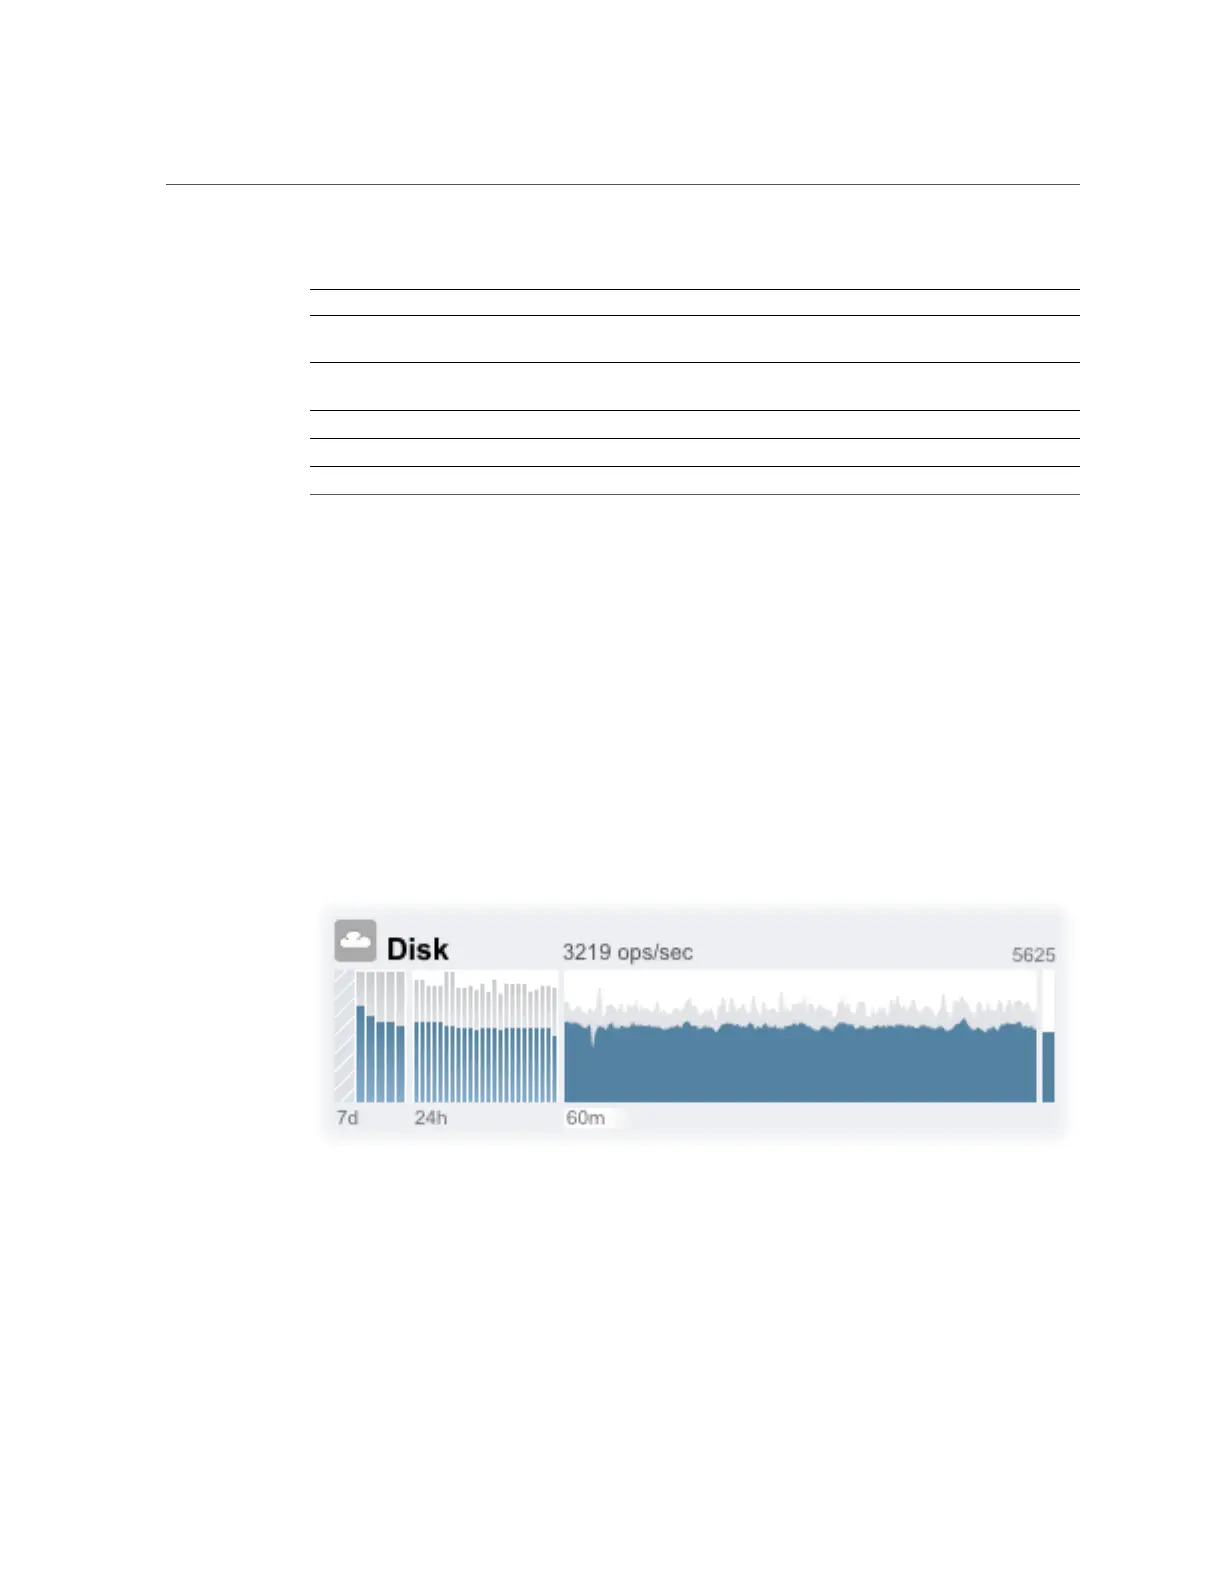
Disk Activity Dashboard
The activity area of the Dashboard shows graphs of eight performance statistics by default. The
example in this section shows Disk operations/sec. The statistical average is plotted in blue and
the maximum appears in light grey.
FIGURE 6
Disk Activity Dashboard
To go to the Analytics worksheet for an activity, click one of the four graphs (day, hour, minute,
second) for the statistic you want to evaluate.
120 Oracle ZFS Storage Appliance Administration Guide, Release OS8.6.x • September 2016
 Loading...