Running the Dashboard Continuously
Status Dashboard Settings
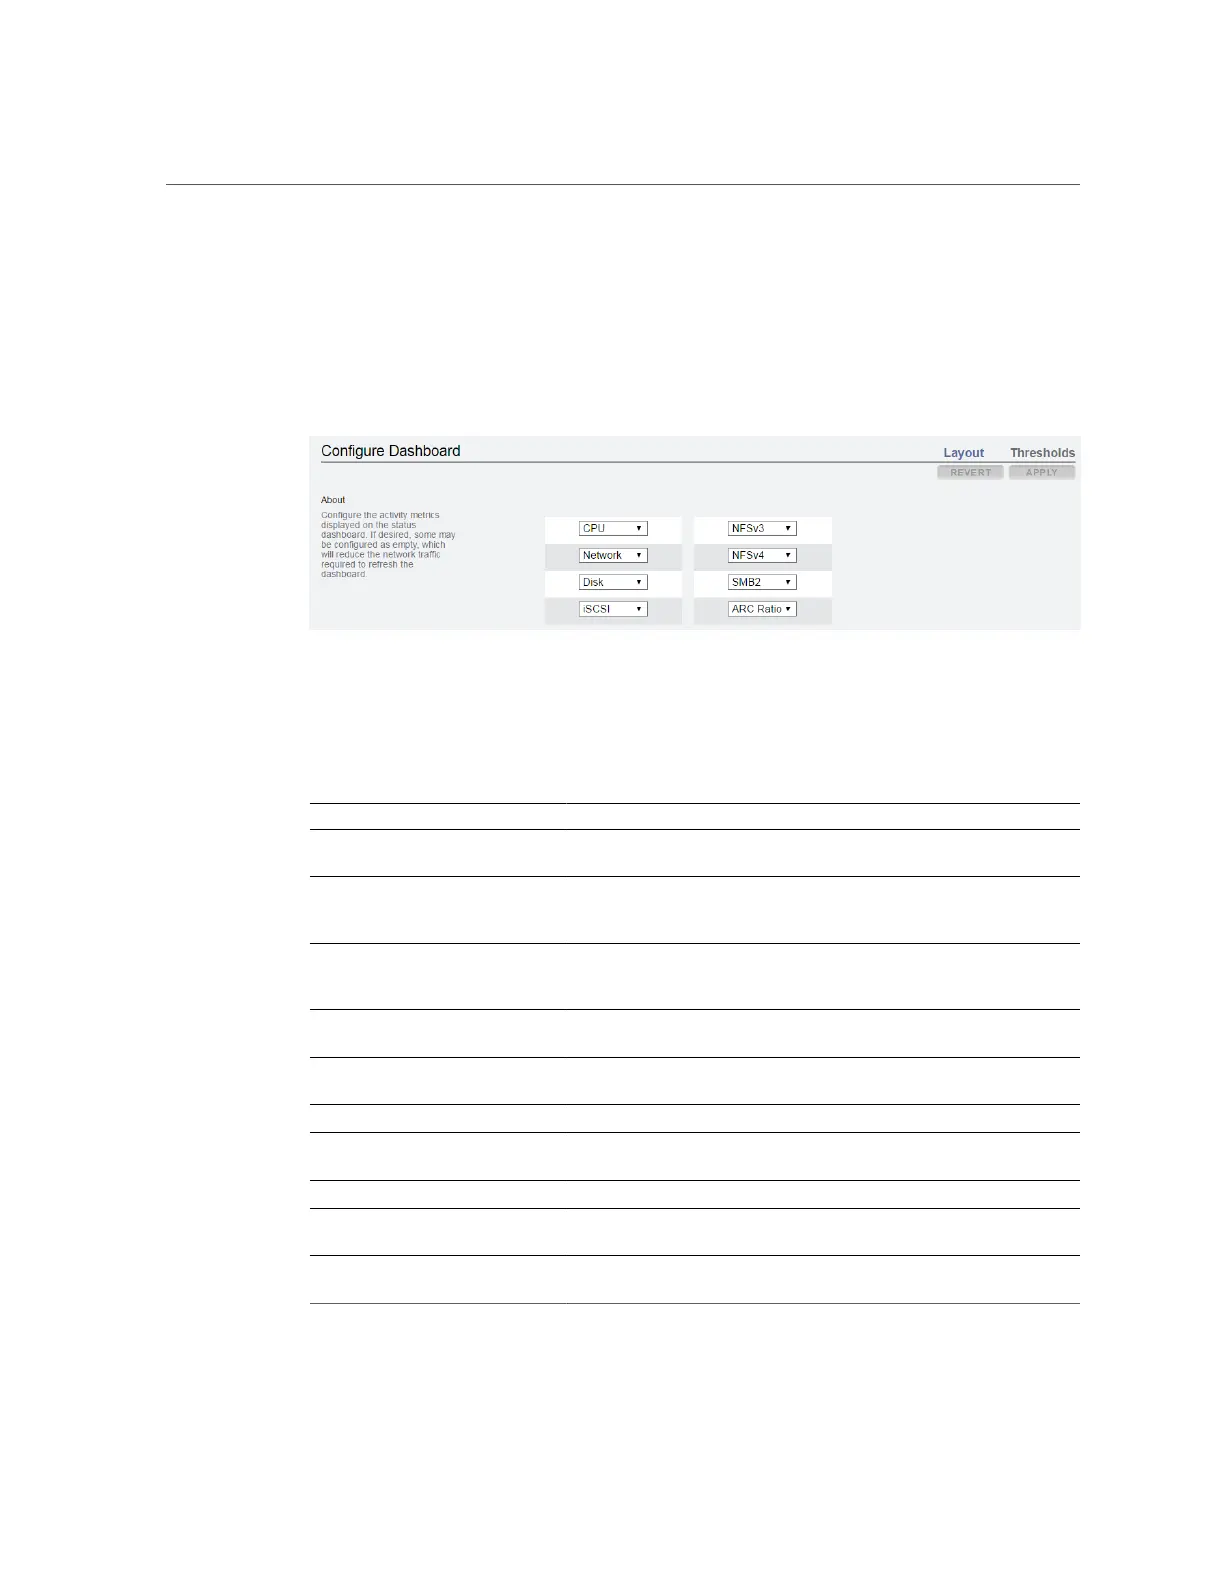
The Status > Settings screen enables you to customize the Status Dashboard, including the
statistics that appear and thresholds that indicate activity through the weather icons.
Use the layout tab to select the graphs that appear in the dashboard activity area, as defined in
the following table.
TABLE 25
Status Layout Settings
Name Units Description
<empty> - No graph will be displayed in this
location.
CPU utilization Average cycles the appliance CPUs
are busy. CPU cycles includes
memory wait cycles.
ARC Ratio utilization Average ARC hit/miss percentage.
A drop in the hit rate indicates a
potential performance problem.
HTTP operations/sec Average number of HTTP
operations.
Disk operations/sec Average number of operations to the
physical storage devices.
iSCSI operations/sec Average number of iSCSI operations.
FC operations/sec Average number of Fibre Channel
operations.
NDMP bytes/sec Average NDMP network bytes.
NFSv2 operations/sec Average number of NFSv2
operations.
NFSv3 operations/sec Average number of NFSv3
operations.
124 Oracle ZFS Storage Appliance Administration Guide, Release OS8.6.x • September 2016
 Loading...