Summary field
List-form
information
Graphical
presentation
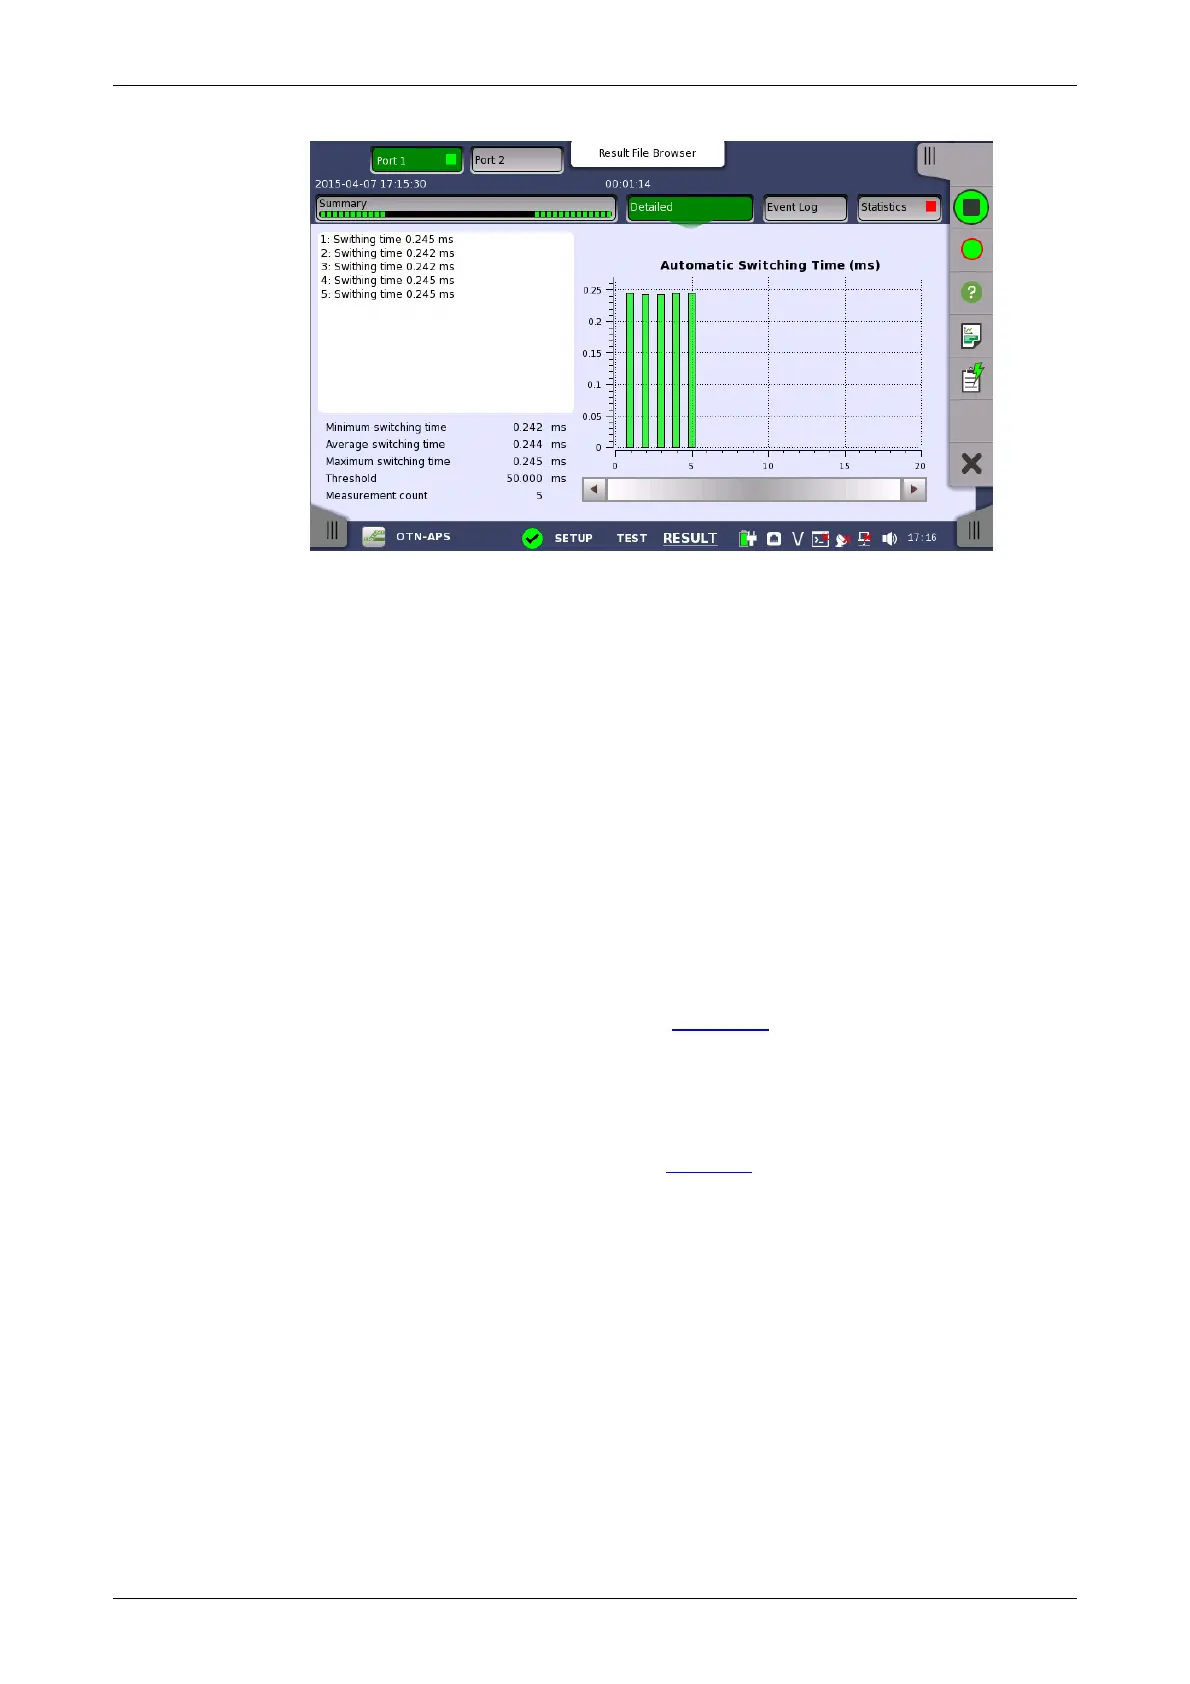
Buttons for selecting the relevant port are displayed at the top of the screen,
with a color indication of the pass/fail status of the test.
This screen presents the detailed results of an OTN APS test. The results
relate to a specific port and consist of the Automatic Switching times of the
APS requests. The data is shown in both list-form and in a graphical
presentation. This screen contains the summary field displayed below the
list.
Consists of the minimum, maximum, and average automatic switching times
in milliseconds, the specified threshold value, the number of measurements.
Presents the automatic switching times in list-form.
The graphical presentation consists of a bar diagram of the automatic
switching times. Results affected by unexpected alarms/errors are indicated.
7.2.3.3 Event Log
Touching the Event Log button in the navigation area displays the screen
providing the event log data. Refer to Event Log of SDH/SONET/PDH/DSn
BERT application.
7.2.3.4 Statistics
Touching the Statistics button in the navigation area displays the screen
providing the statistics data. Refer to Statistics of BERT for the operation.
7.3 BERT