Understanding the Appliance Status
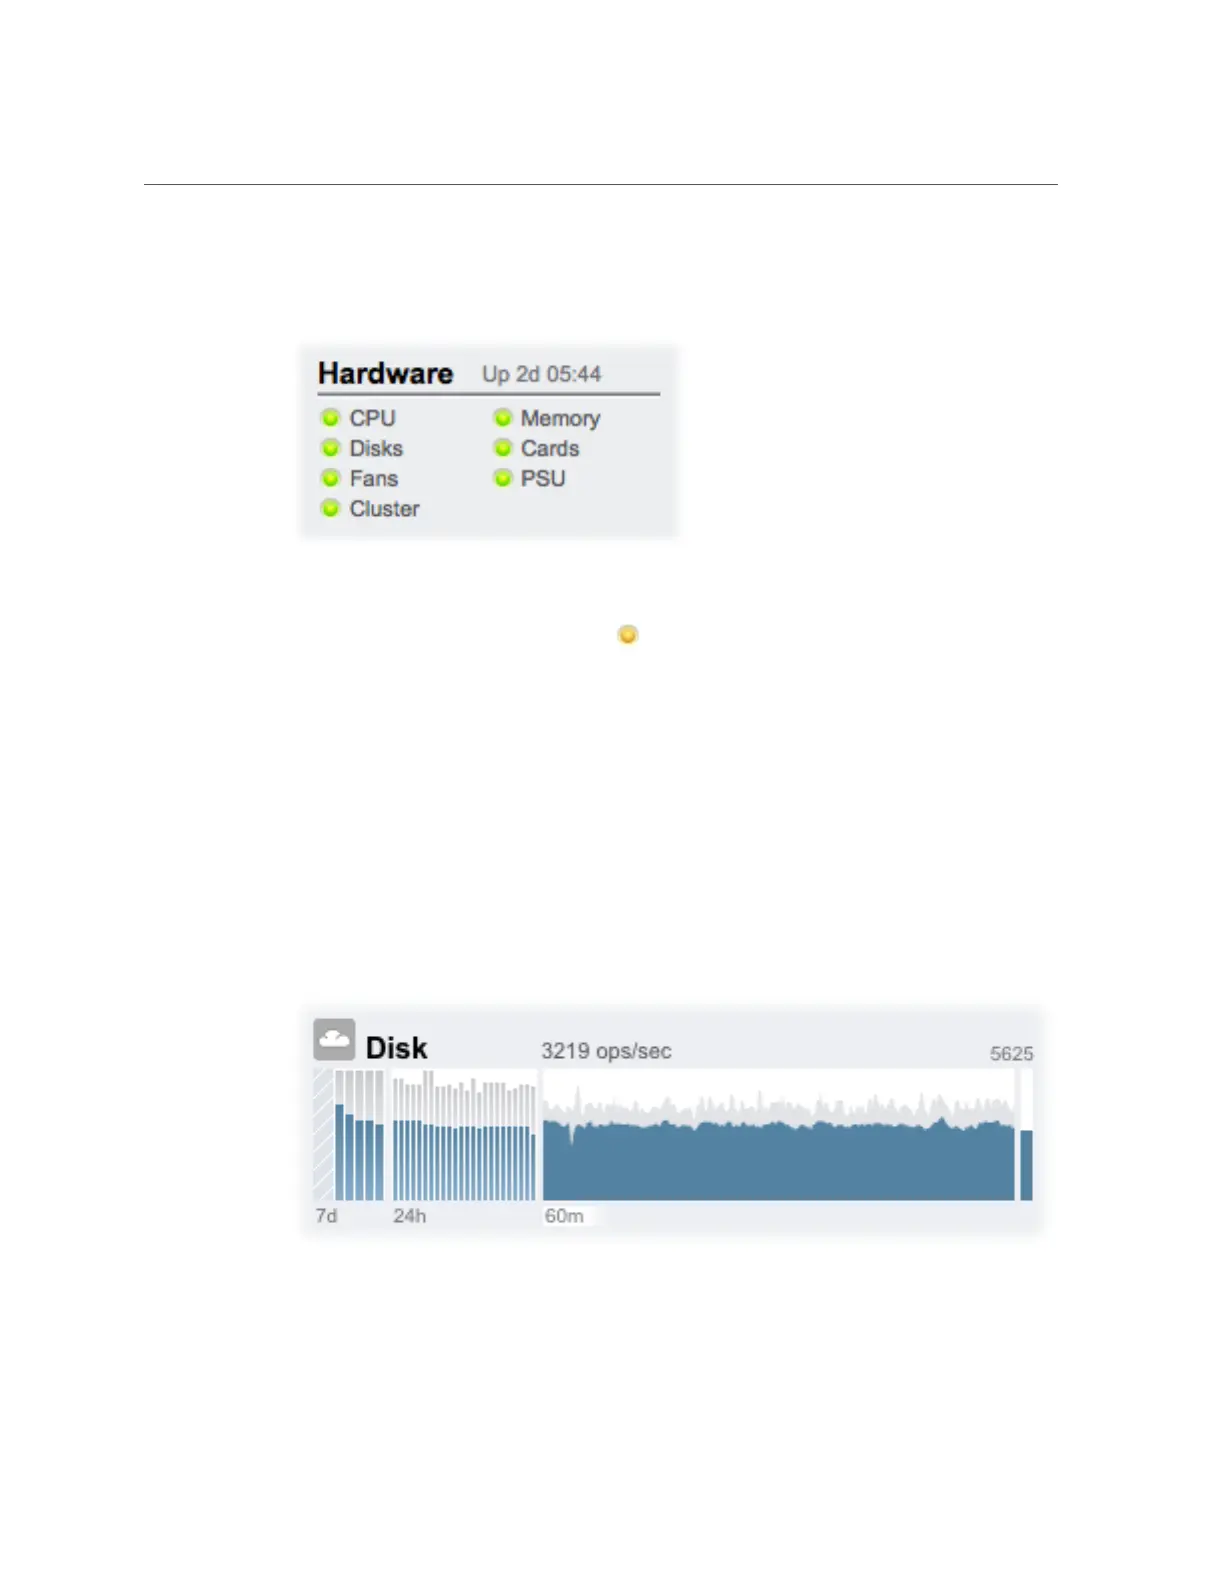
FIGURE 3
Hardware Dashboard
If there is a known fault, the amber fault icon appears.
To go to the Hardware screen for a detailed look at hardware state, click the name of a hardware
component.
Dashboard Activity
The activity area of the Dashboard shows graphs of eight performance statistics by default. The
example in this section shows Disk operations/sec. The statistical average is plotted in blue and
the maximum appears in light grey.
FIGURE 4
Disk Activity Dashboard
Configuring the Appliance 117
 Loading...