Understanding the Appliance Status
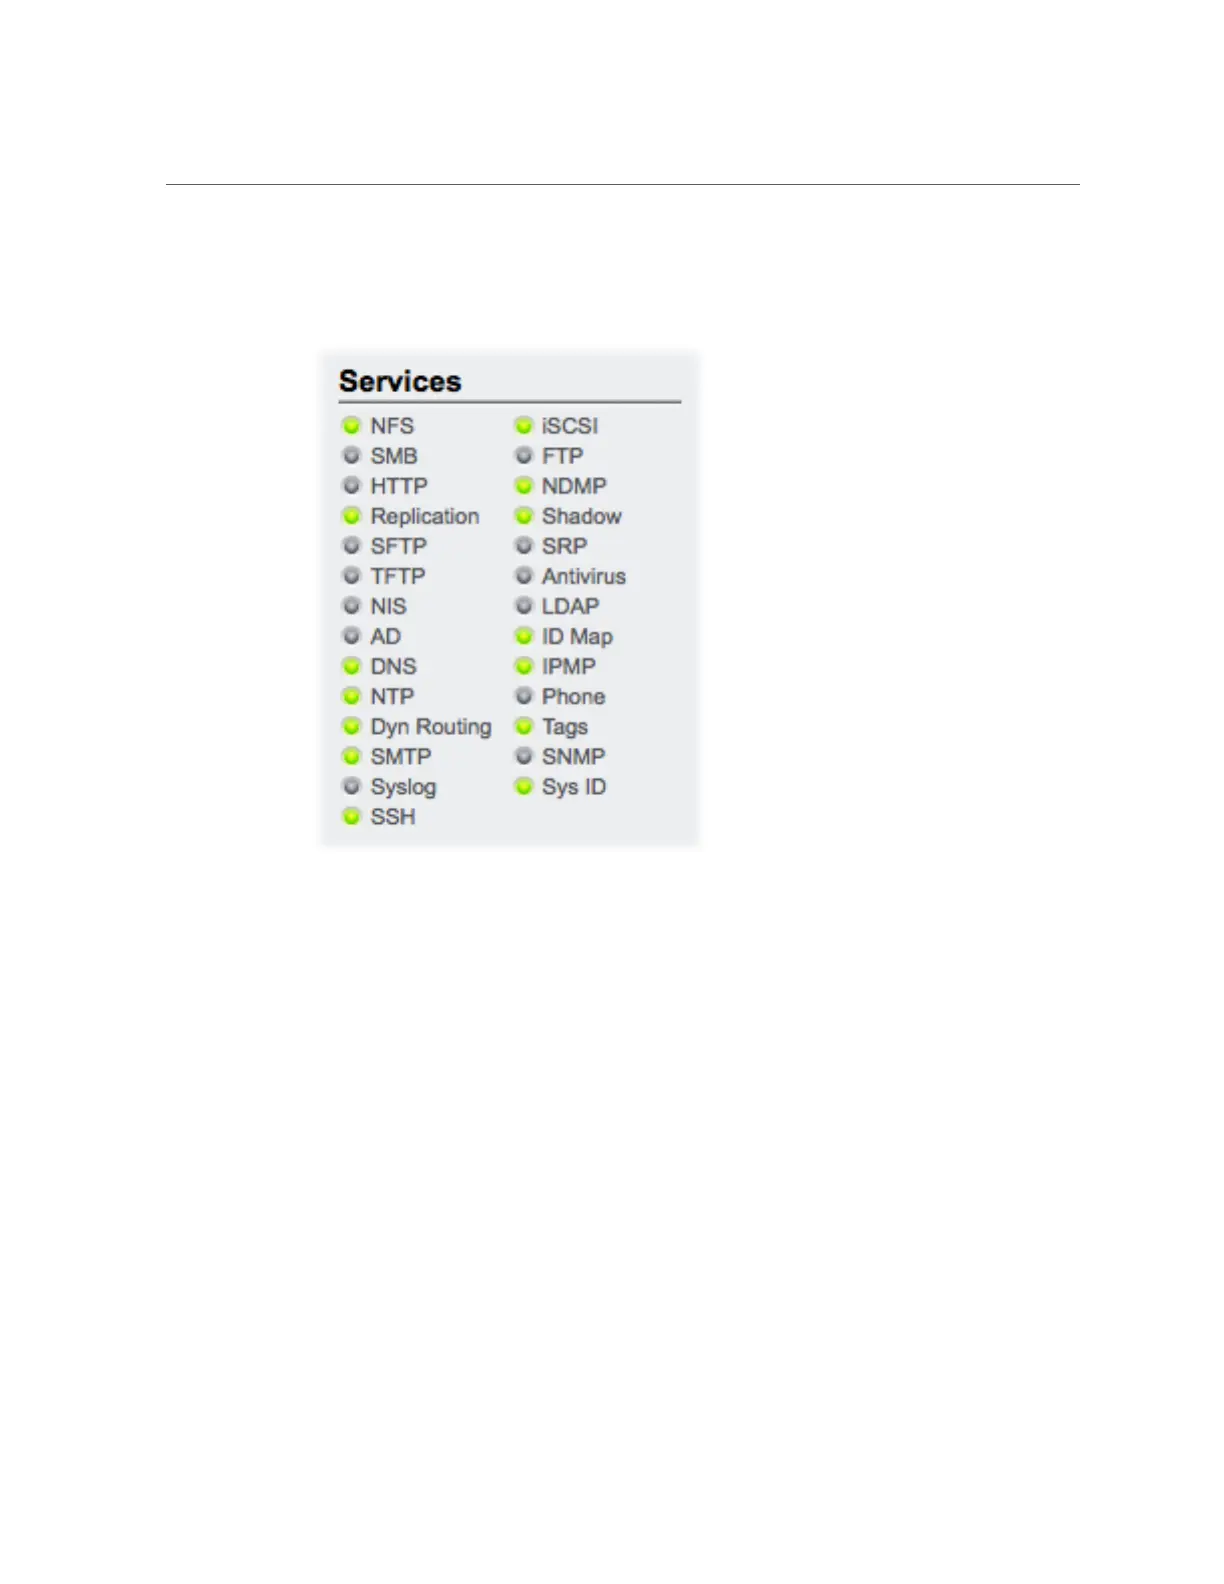
FIGURE 2
Services Dashboard
Most services are green to indicate that the service is online, or grey to indicate that the service
is disabled. For a reference of all possible states and icon colors, see “Browser User Interface
(BUI)” on page 22 for a reference of all possible states and icon colors.
To go to the associated configuration screen, click on a service name. The Properties screen
appears with configurable fields, restart, enable, and disable icons, and a link to the associated
Logs screen for the service.
Dashboard Hardware
This area of the Dashboard shows an overview of hardware on the appliance.
116 Oracle ZFS Storage Appliance Administration Guide, Release OS8.6.x • September 2016

 Loading...