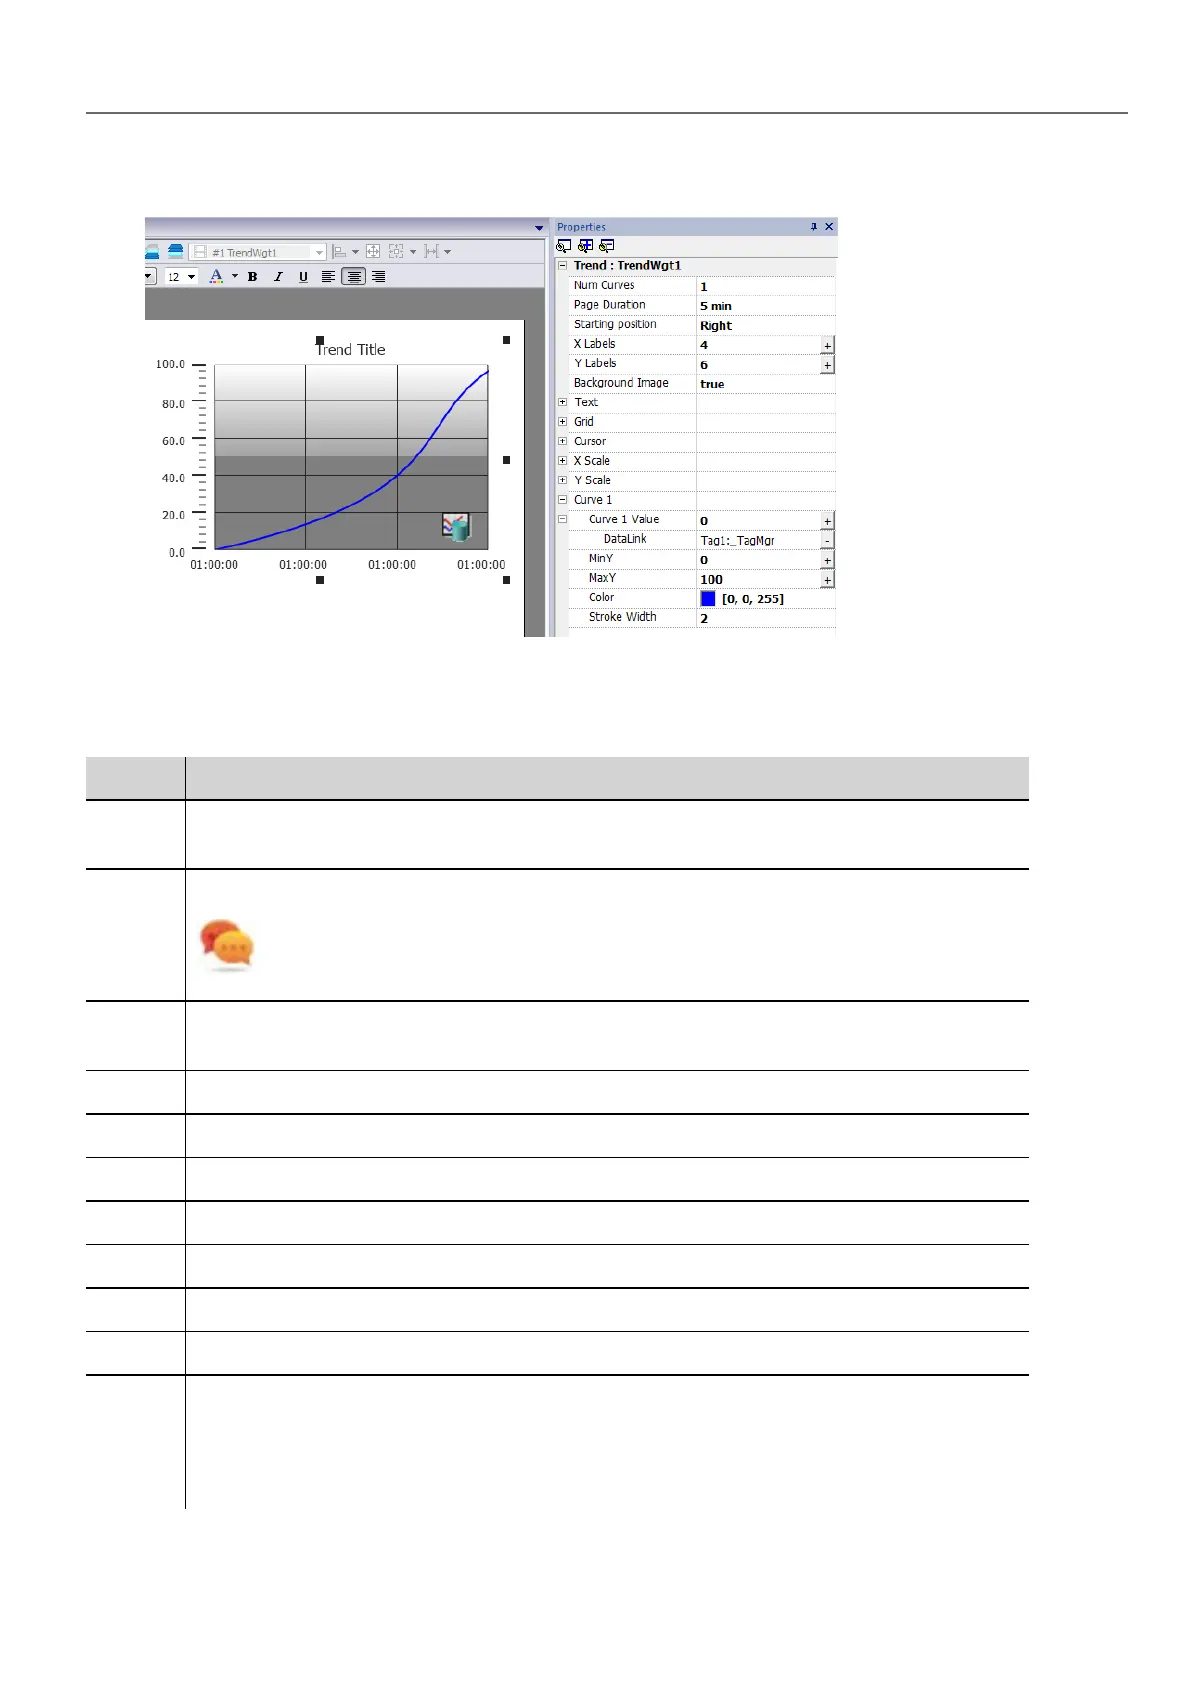
1. Drag and drop the RealTime Trend widget from the widget gallery to the page.
2. Attach the tag that you want to sample to the Curve n Value. Data is always plotted against time.
RealTime trend widget properties
Property Description
Num
Curves
Number of trend curves to be displayed (Max. 5)
Page
Duration
Time range of the x-axis.
Tip: You can attach a Date Time combo widget to the Page Duration property and
dynamically change page duration at run time.
Starting
Position
Specifies the starting point of the curve when the page is opened.
X Labels Number of ticks on the x-axis scale
Y Labels Number of ticks in the y-axis scale.
Text Trend title and font properties (font size, label, etc.)
Grid Properties of grid presentation (colors)
Cursor Properties of cursor presentation (enable and color)
X Scale Properties of X Scale presentation
Y Scale Properties of Y Scale presentation
Curve
"n"
Tag that will be plotted in the trend widget. See "Trend widget properties" on page195 for details.
You can set the minimum and maximum of the curves (MinY, MaxY). You can attach a tag to
minimum and maximum properties. This enhances the ability to change the minimum and
maximum values dynamically at run time.
HMWIN Studio |User Manual| v206 (2017-06-30) | EN| © 2014-2017 Panasonic Electric Works Europe AG
193
17 Trends