Scaling data
Tag values can be scaled using the X Forms in the Attach to dialog. See ""Attach to" parameters" on page30 for details.
History trends
Trend data stored in trend buffers can be analyzed using the History Trend widget.
This is a two-step process:
l first you create a trend buffer to collect data for specified tags at specific points in time,
l then you configure a History Trend widget to display the collected data in a graphical format.
See "Data logging" on page190 for details on how to create a trend buffer.
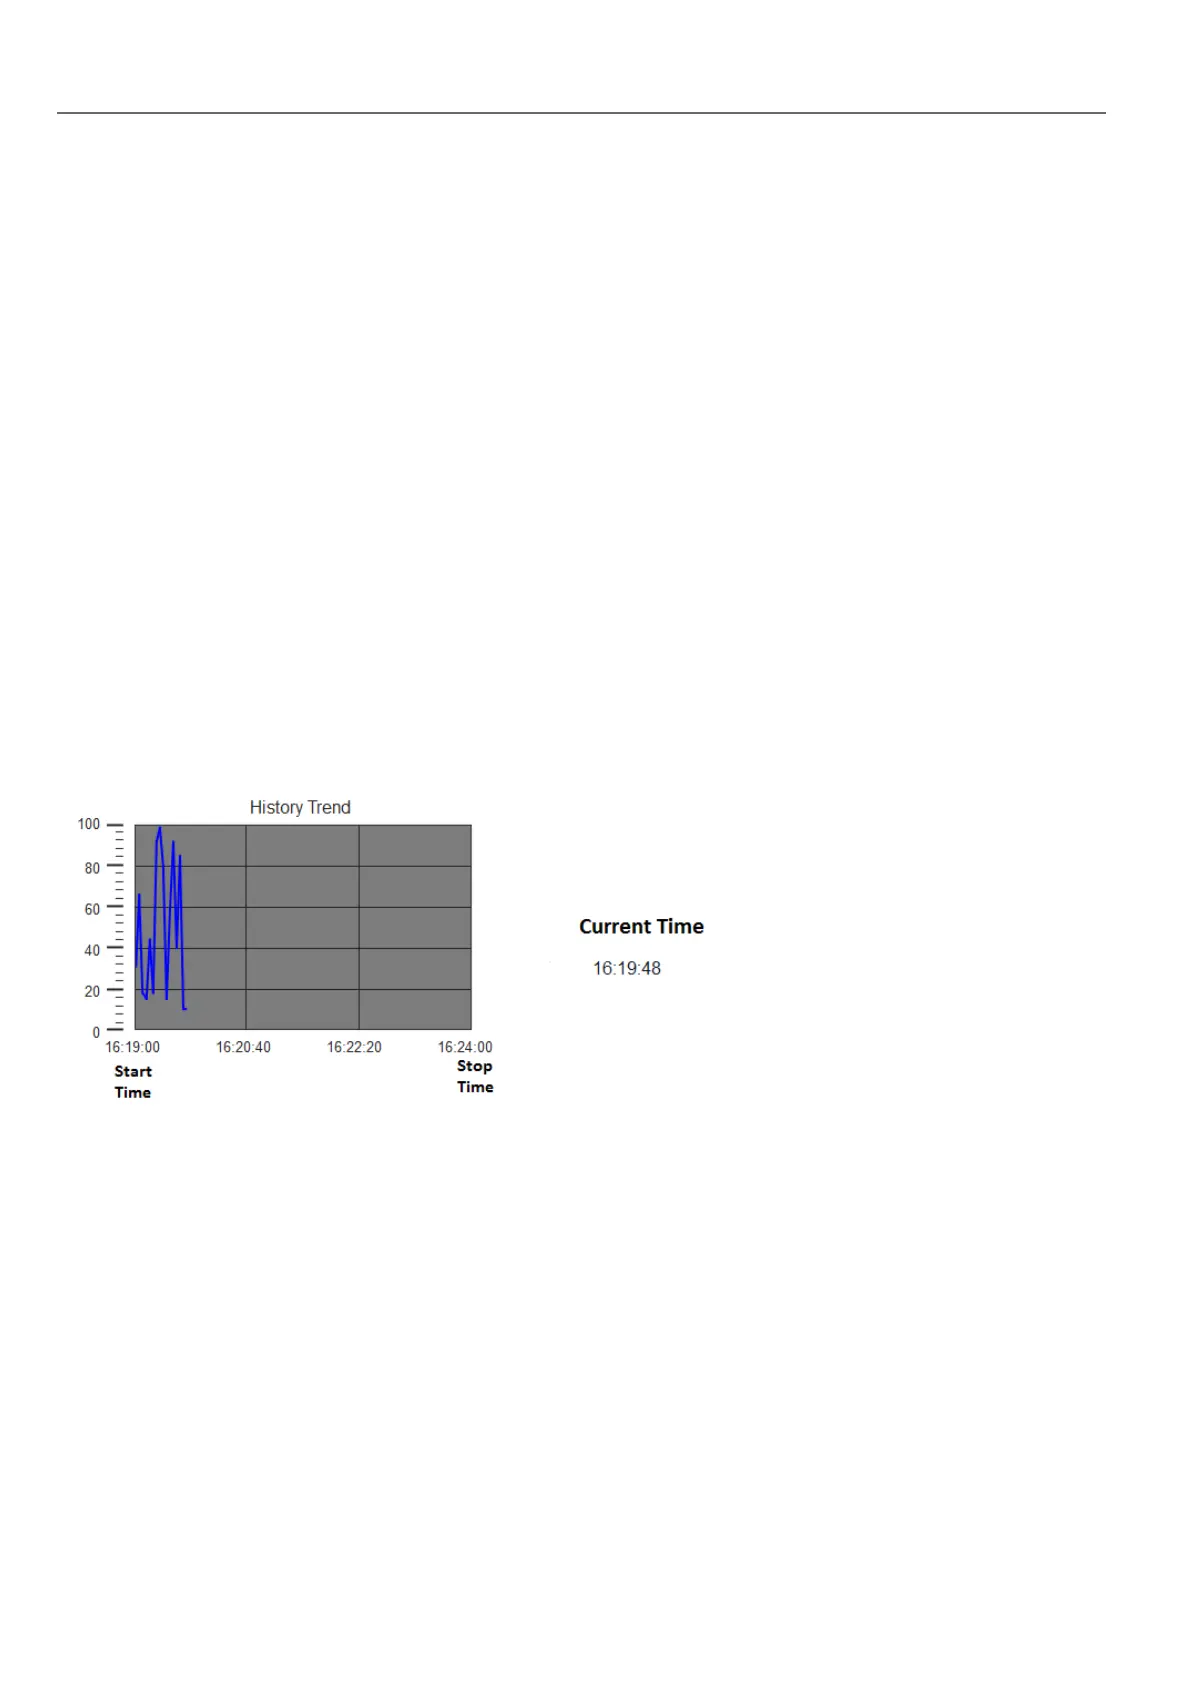
History Trend widget
History Trend widget displays in graphical format the content of a trend buffer.
Start time is the current time and stop time will be the current time plus the duration of the window. The curve starts from
the left and progresses to the right, data is automatically refreshed during a certain interval time, until the stop time.
When the curve reaches the stop time, the curve will scroll left and the update of the curve will continue until it again
reaches the stop time. At that moment a new scroll is automatically performed and the process repeats.
History trends require a proper configuration of trend buffer.
See "Data logging" on page190 for details on how to work in the Trend editor.
Configuring the History Trend widget
1. From the Trends/Graphs section of the Widget Gallery, drag and drop the History Trend widget to the page.
194
HMWIN Studio |User Manual|v206 (2017-06-30) |EN|© 2014-2017 Panasonic Electric Works Europe AG
History trends