Color bands
Use the color bands configuration to customize your graphs background, for example to make certain days or hours stand
out (weekends, night hours, etc.).
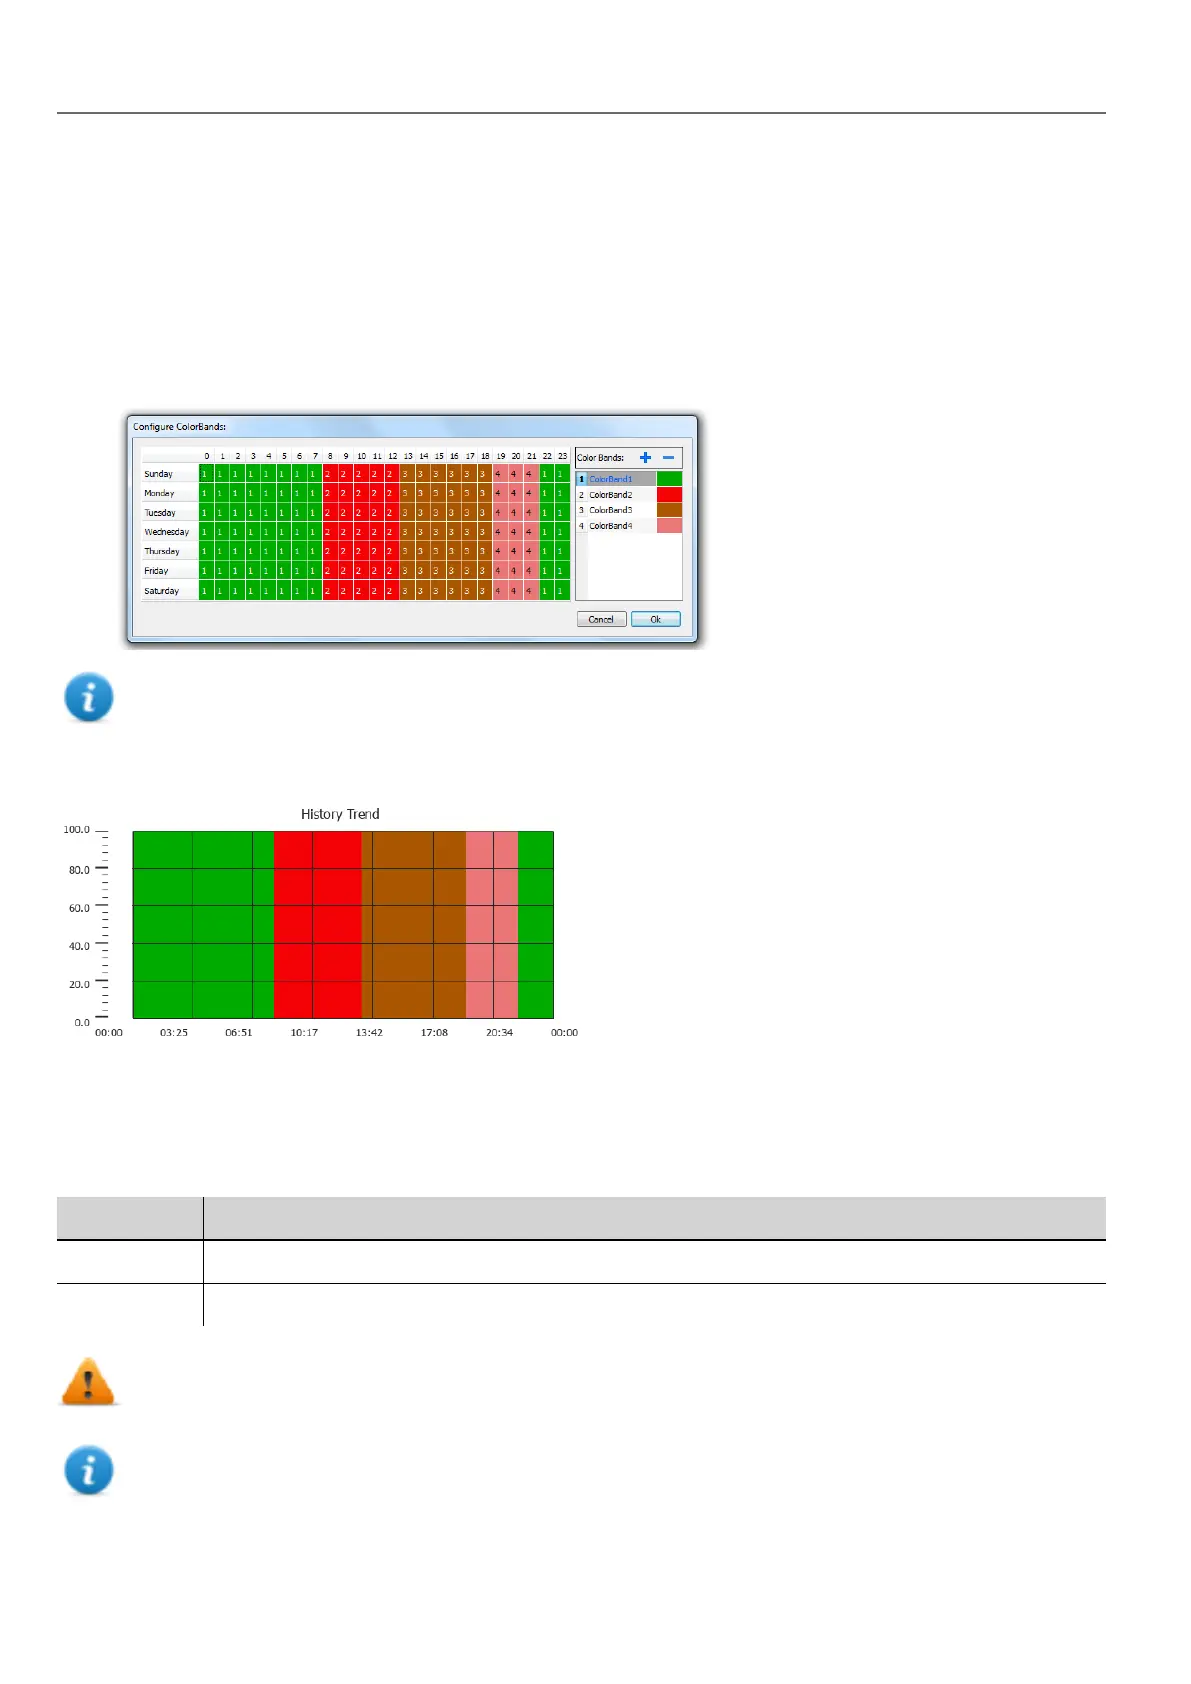
1. In the Properties pane, in Color Bands property click +: the Configure Bands window appears.
2. Click + to add as many colors you need.
3. Select multiple cells and click on a color band to assign the color to the selected range of cells.
Note: This feature only uses local time in the trend widget, not the global time option.
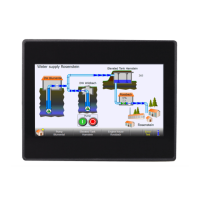
Calendar color bands example
Trend widget gestures
Trend widgets support gesture commands:
Gesture Description
pan Touch the widget to scroll the curve within the widget area
pinch Use two fingers to pinch the curve and perform zoom operations
WARNING: Only multi touch HMI devices can generate pinch events
Note: In order to support gestures on Y axis, Min/Max properties of the trend widget must be linked to Min/Max
values of Behavior parameters (default for new trends).
196
HMWIN Studio |User Manual|v206 (2017-06-30) |EN|© 2014-2017 Panasonic Electric Works Europe AG
Trend widget gestures