CPU statistics are collected with a frequency of 2000 milliseconds. The actual period and the overhead required to collect
and visualize statistics are displayed as well. The more the actual period is far from the nominal 2000 milliseconds the
higher is the system load. CPU consumption of threads is listed reporting the name of the thread (if available, main thread
is marked with a *), the thread ID, the thread priority and CPU time spent during the 2000 milliseconds period, divided in
user and kernel time.
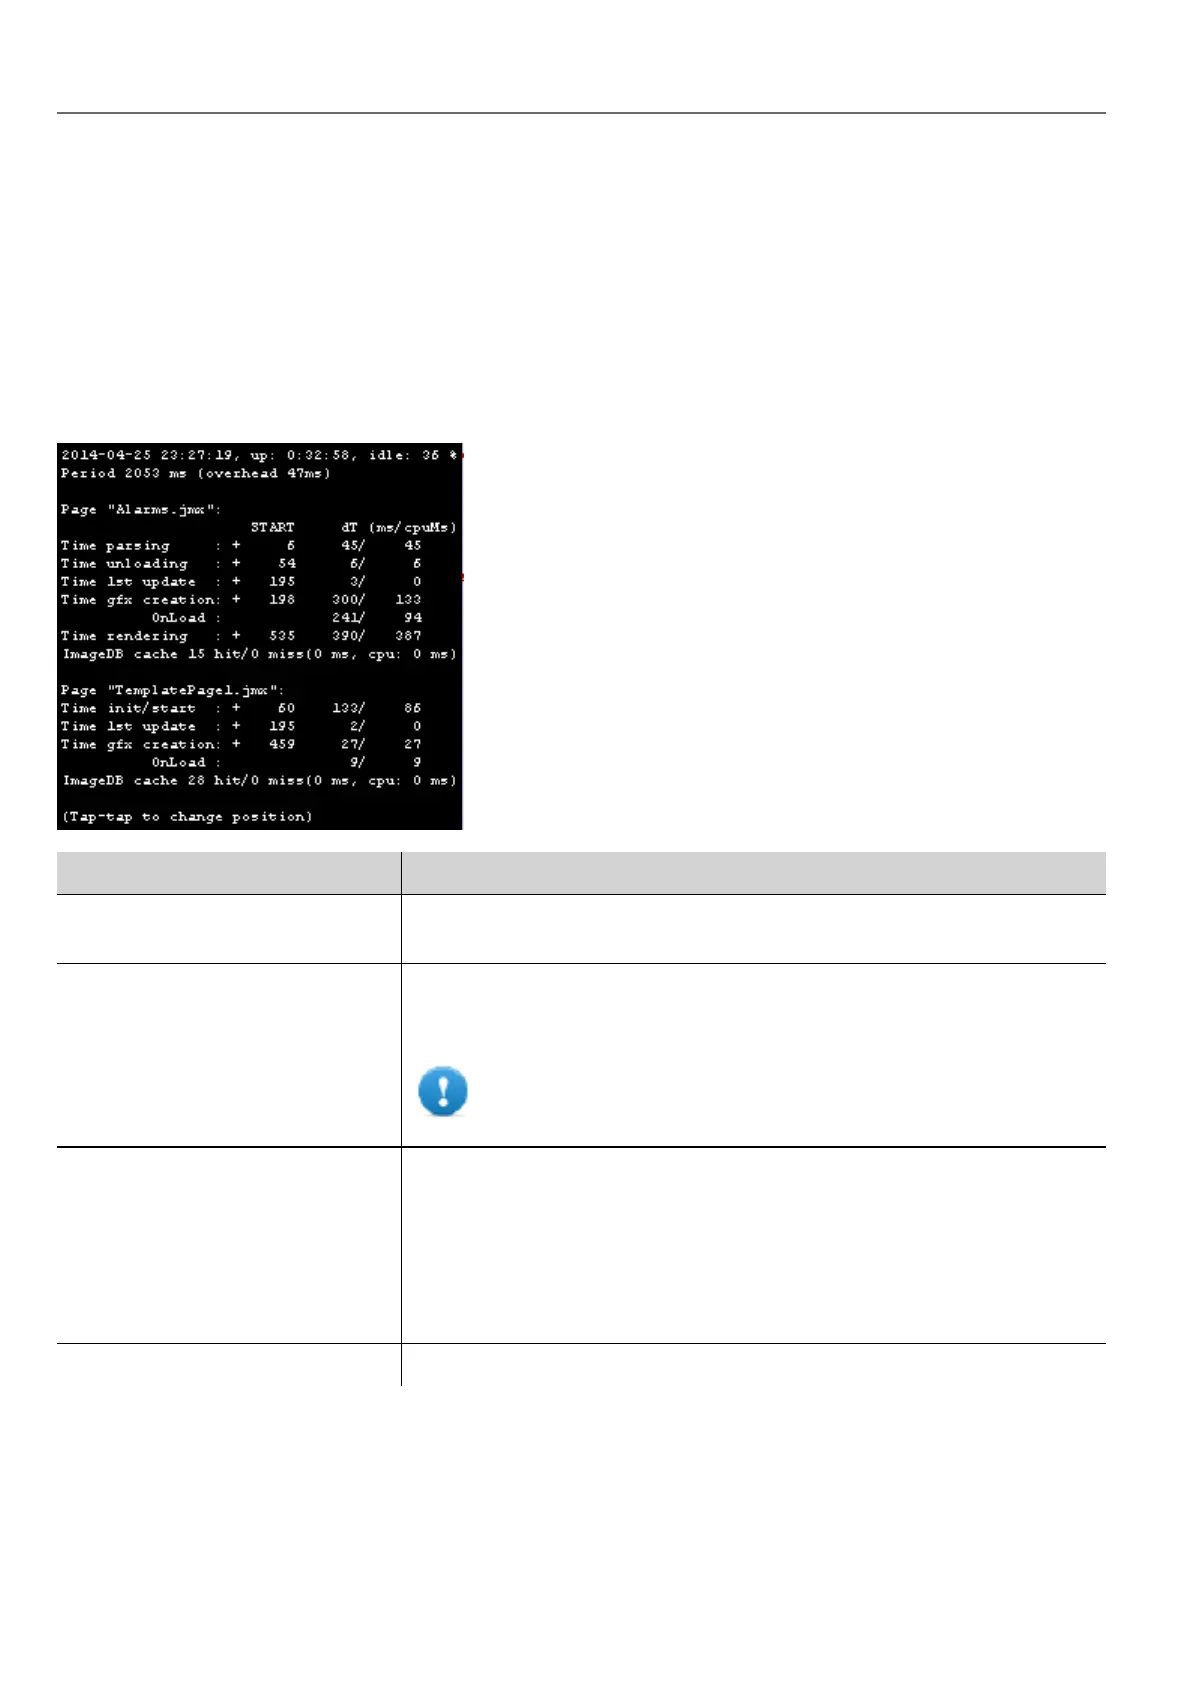
Profiling
Profiling allows you to check time spent for loading/rendering the active page. Profiling will start from the next page load
and will be active only for the first painting of the page to the screen (the configuration is retained).
Profiling option Description
Enable timelog Enable timelog capture. Timing will be visible inside the “Timelog summary”
window.
Save timelog to file Saves a report of profile details and the time spent loading a project and its
pages into a timelog.txt file. This file can be exported and shared for further
analysis.
Important: The execution of this function may reduce page
change performance.
Overlay OnLoad times
Overlay Rendering times
This view allows displaying time spent on single widgets and is available only for
the rendering and OnLoad steps. The view gives an immediate feeling of where
time is spent. Red zones represent the most time critical zones. Detailed widget
times are visualized by a tooltip window (on Win32 platform attached to mouse
over event, on Windows CE press drag and release over the region of interest).
In case of out-of-the-scene widgets some arrows allow to navigate to these
areas and hovering on them the tooltip will show the area summary
Select overlay color Select the overlay color to use
54
HMWIN Studio |User Manual|v206 (2017-06-30) |EN|© 2014-2017 Panasonic Electric Works Europe AG
Developer tools