Glossary of Terms 313
V4.2 LabChip GX User Manual PerkinElmer
Marker Drift Tolerance
Isolating the markers in the sample is key to alignment and sizing.
The markers in the sample appear similar in size and migration time
to the markers in the ladder. Markers are discriminated from nearby
peaks through a weighing scheme which attributes a numerical
value to the migration time similarity and area similarity. This
approach is usually successful as long as the first peak is the
marker, but when there is a peak of similar size arriving just before
the true marker, the first marker is likely to be confused with the
marker. When the primary differentiator between the two peaks is
the migration time, the marker drift tolerance can be used to narrow
the acceptable range for the migration time by increasing the
importance of the similarity between the sample and ladder marker
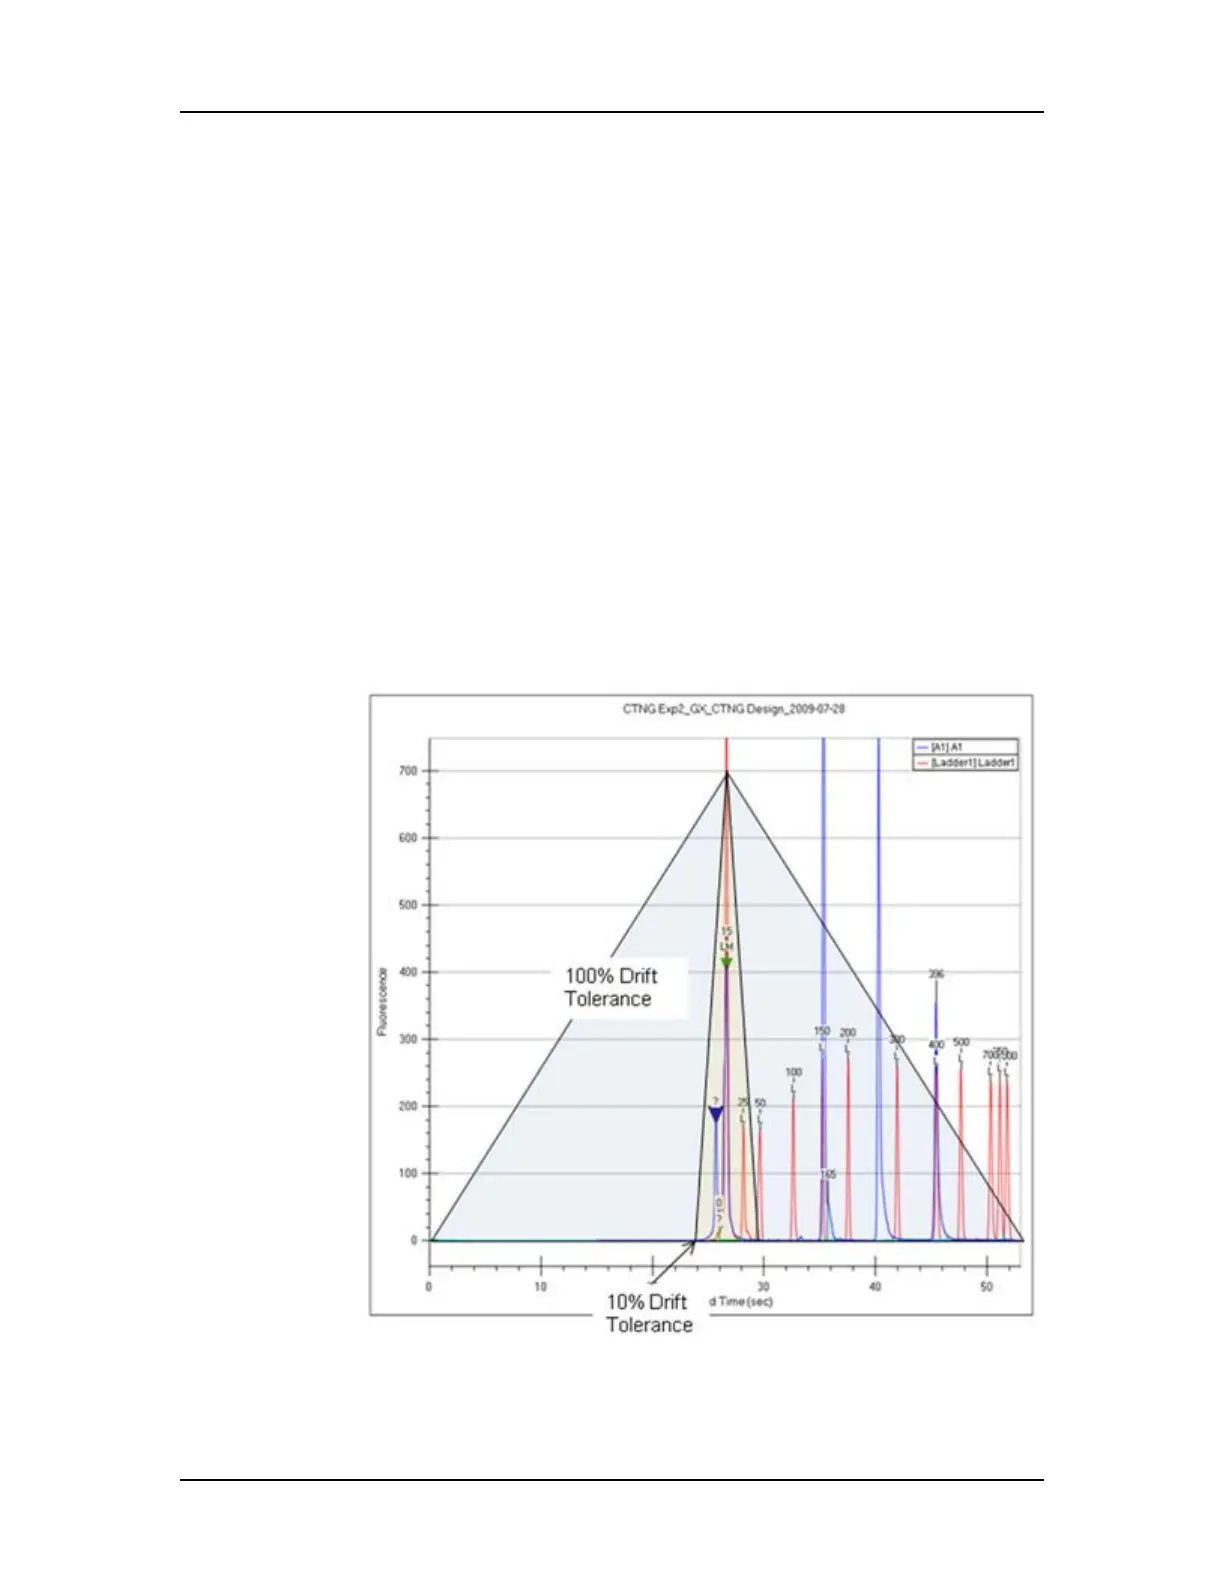
peak times. The marker drift tolerance specifies the accepted range
as a percentage of the ladder migration time. The blue and yellow
triangles shown in the figure below represent the weight assigned
to a peaks migration time for a tolerance of 100% and 10%
respectively.
Figure 143. Marker Drift Tolerance

 Loading...