Data Analysis 89
V4.2 LabChip GX User Manual PerkinElmer
Viewing Graphs in the Overlay Electropherograms Tab
If the Overlay Electropherograms Tab is not open, select Collection
Layout on the LabChip GX Main Window, select the location
where you want to display the Overlay Electropherograms tab, and
click the Apply button. The Overlay Electropherograms tab opens.
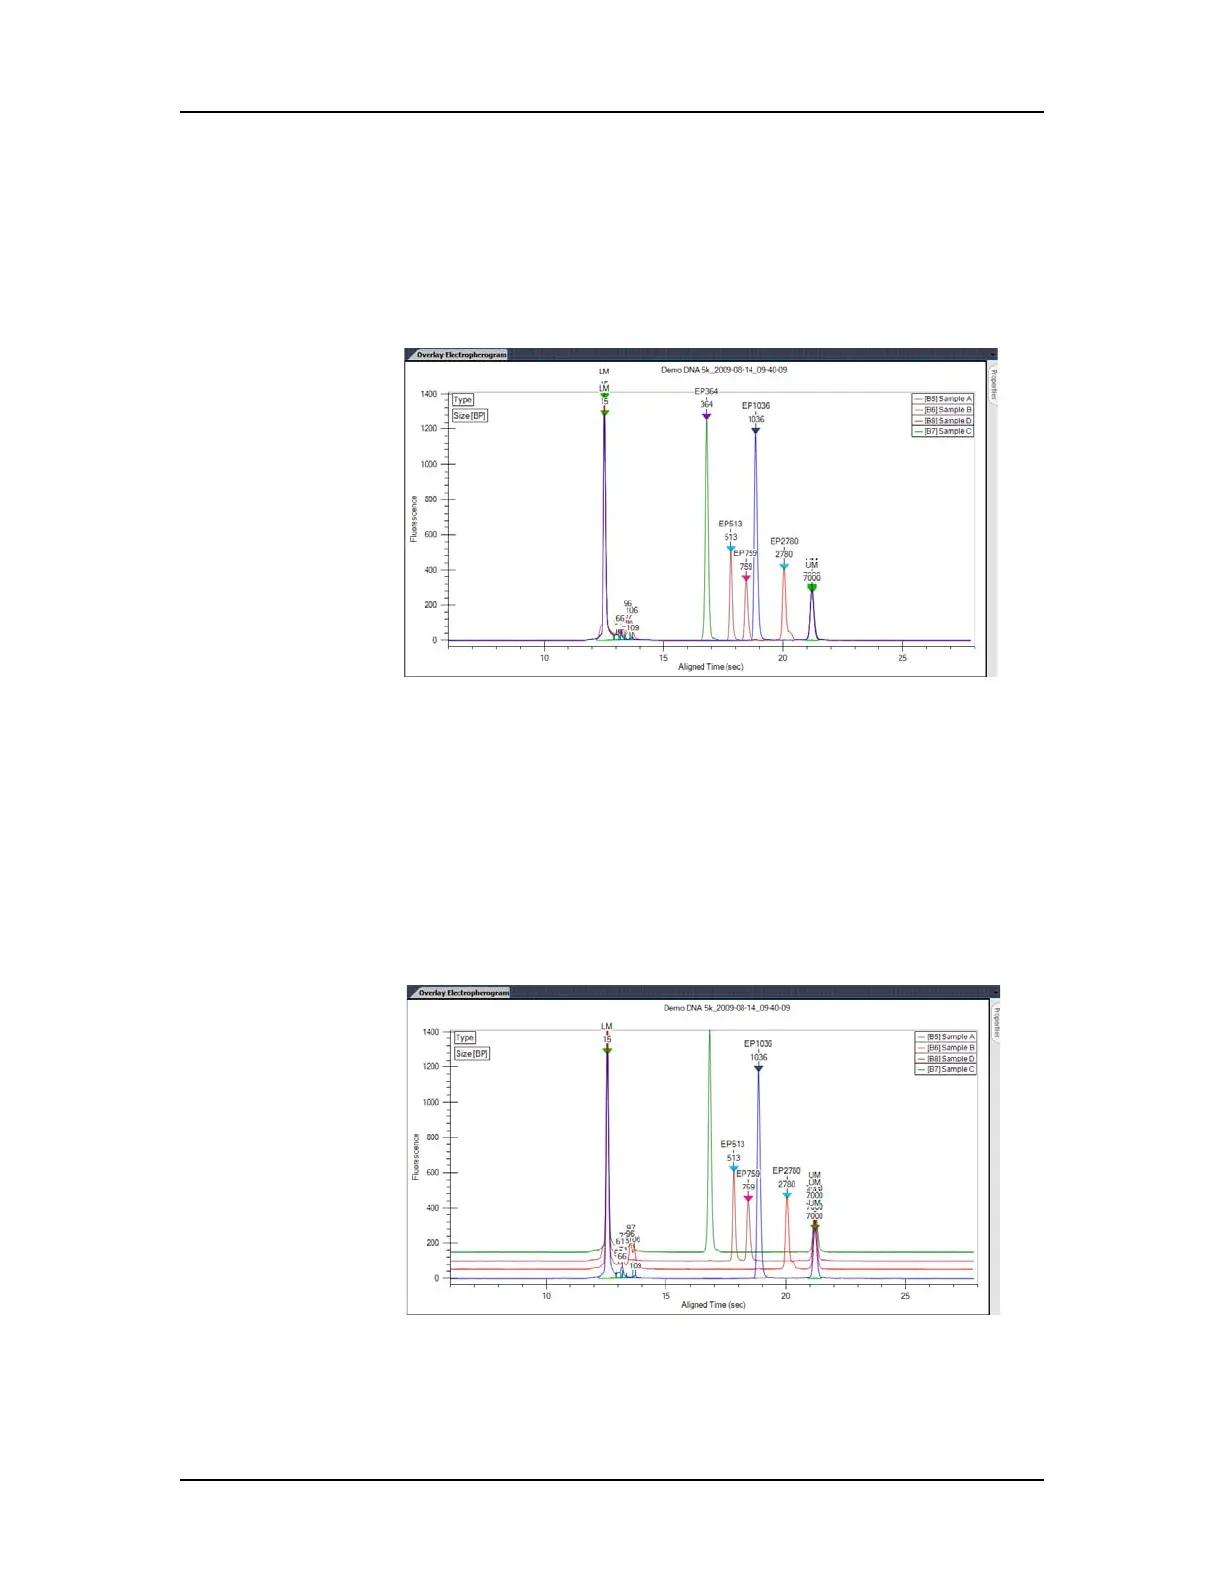
Figure 35. Overlay Electropherograms Tab with Multiple
Graphs
Data from multiple wells can be overlaid in the same graph for
visual comparison. Click on one well, then hold down the CTRL key
and click on the additional wells to view in the graph. Each peak
graph is shown in a different color and line style with a legend at the
top of the window. You can remove wells from the overlay by CTRL
+ clicking the corresponding wells (the bounding box disappears).
Use the Overlay Offset text box on the Graph View Properties to
offset each of the graphs by the RFU value specified.
Figure 36. Overlay Offset

 Loading...


