Data Analysis 43
V4.2 LabChip GX User Manual PerkinElmer
How the Software Analyzes DNA Data
The LabChip GX DNA Assay Analysis calculates the size and
concentration of nucleic acid fragments. Results for each well are
calculated after all data for that well has been read.
The data analysis process for DNA assays consists of the following
steps:
1 Raw data is read and stored by the system for each individual
well.
2 The data is filtered (see “Data Filtering” on page 307) and the
resulting electropherograms of all wells are plotted.
3 Peaks are identified (see “Understanding Peak Finding” on
page 108) for all wells and are tabulated by migration time. The
settings of the peak find algorithm can be changed and the data
can be reanalyzed after the run has finished. (See “Reanalyzing
a Data File” on page 95.) The peak find settings can be changed
for all wells or only for specific wells.
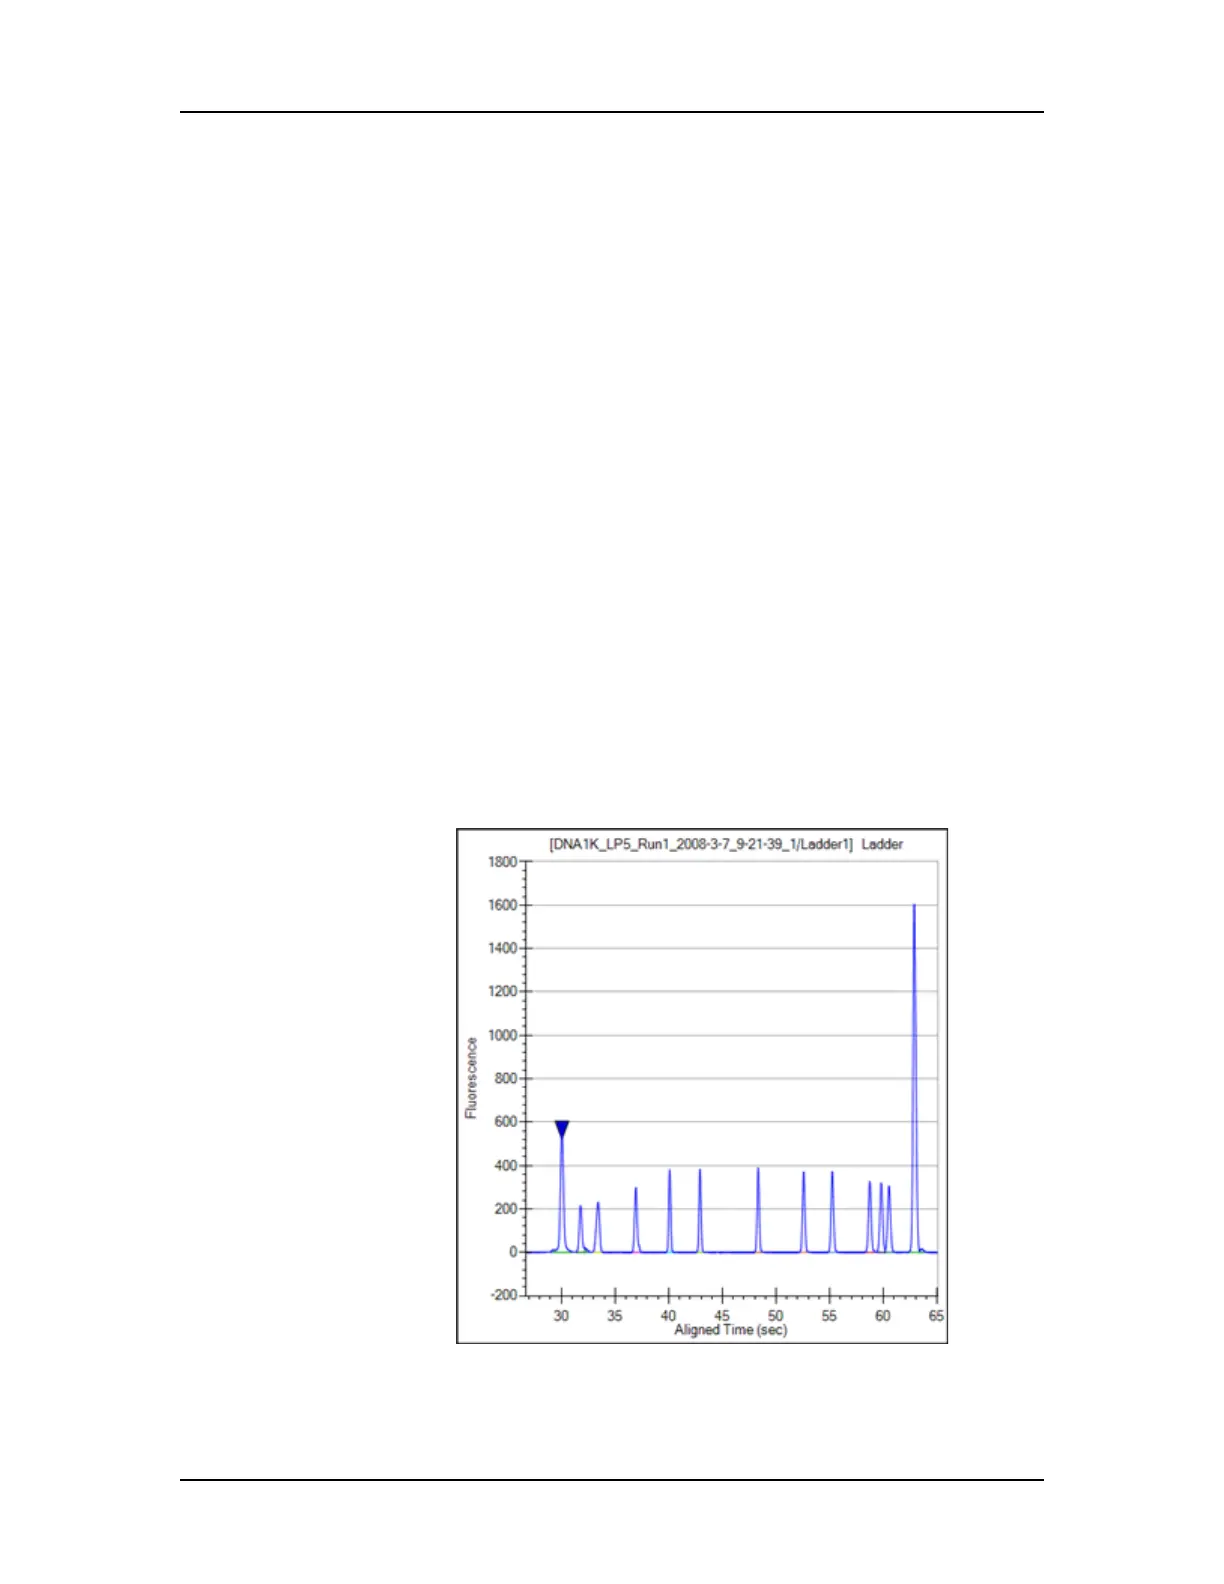
4 A sizing ladder (see Figure 8), which is a mixture of DNA
fragments of different known sizes, is run first from the ladder
vial. The concentrations and sizes of the individual base pairs in
the ladder can be changed on the Analysis Tab.
Figure 8. Ladder Graph - DNA
 Loading...


