Data Analysis 44
V4.2 LabChip GX User Manual PerkinElmer
How the Software Analyzes DNA Data
(Continued)
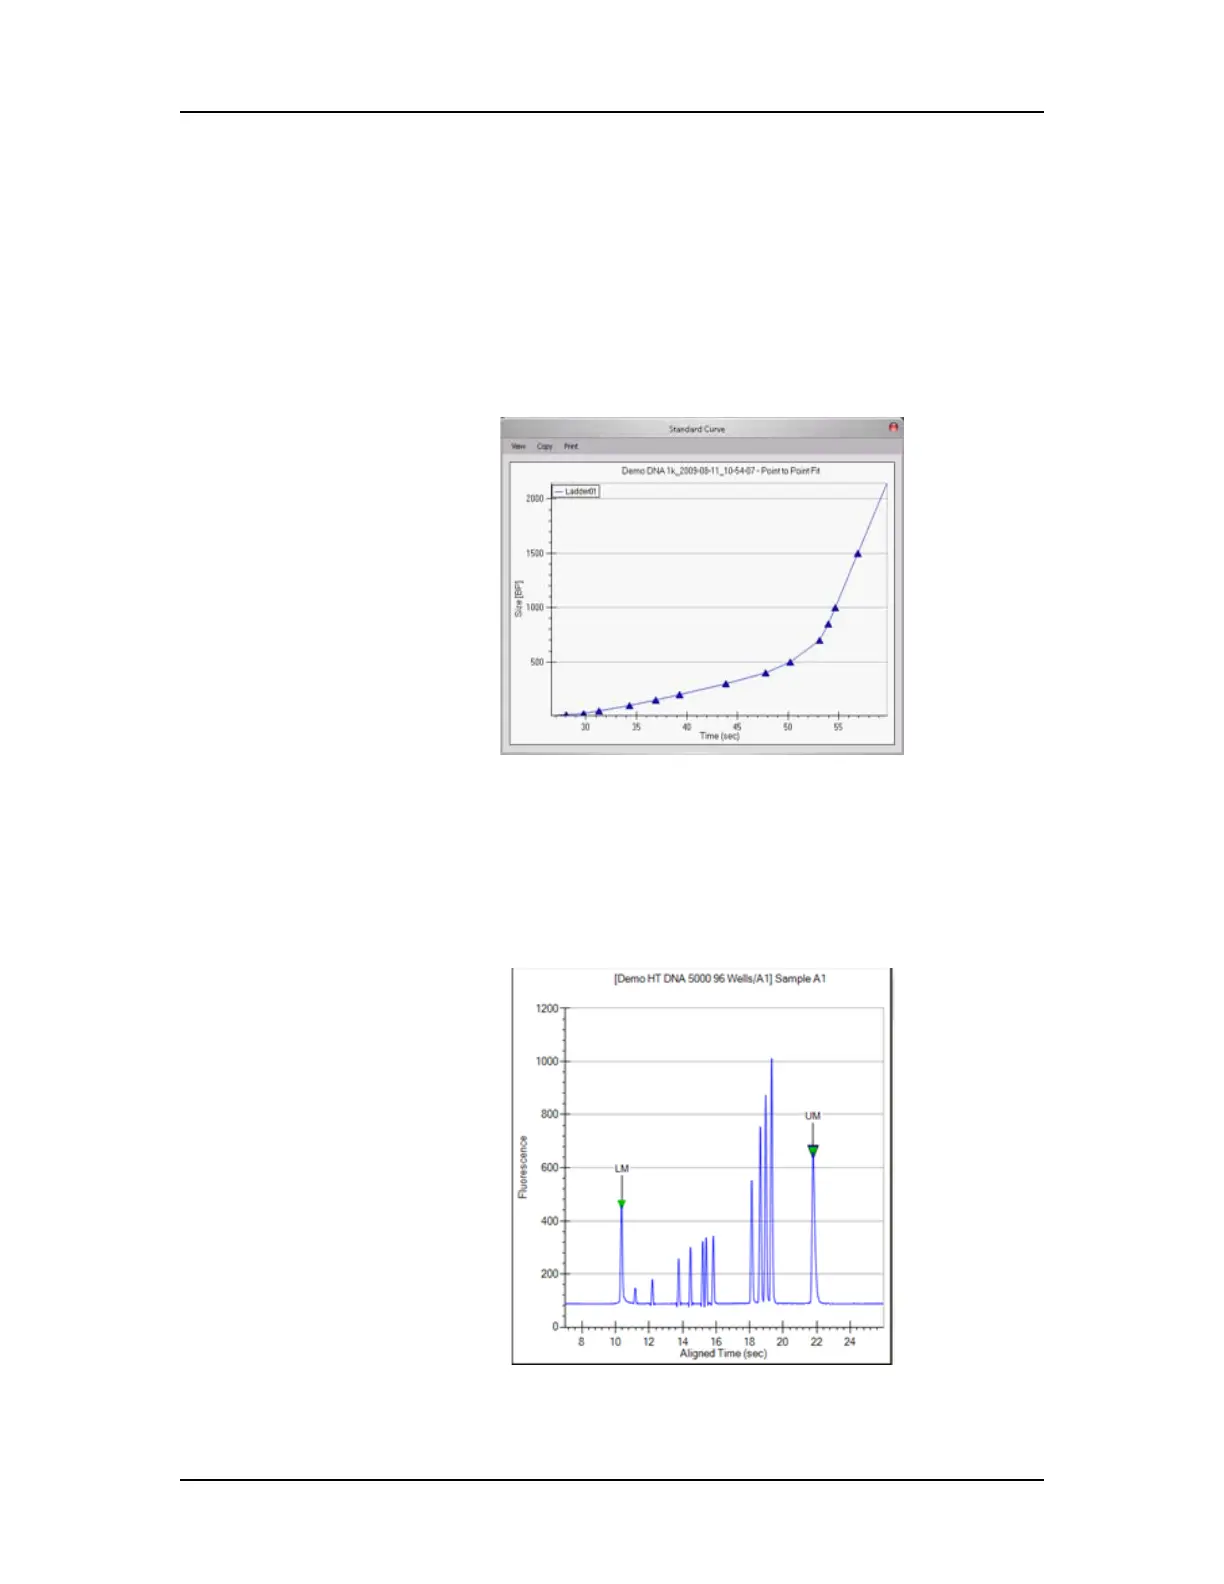
5 The ladder is analyzed (see “Ladder Analysis” on page 311) and
a standard curve of migration time versus DNA size is plotted
from the DNA ladder by interpolation between the individual
DNA fragment size/migration points. The standard curve derived
from the data of the ladder well should resemble Figure 9.
Figure 9. Standard Curve Window - DNA
6 Two DNA fragments, the Lower Marker and Upper Marker, are
run with each of the samples, bracketing the DNA sizing range.
The Lower Marker and Upper Marker are internal standards
used to align the ladder data with data from the sample wells.
Figure 10 shows an example of assigned marker peaks in a
sample well.
Figure 10. Markers - DNA

 Loading...


