Software Reference 183
V4.2 LabChip GX User Manual PerkinElmer
Filter View (Continued)
In the Plate diagram (above), the pink and black wells are the wells
that meet the filter criteria. To see the gels of each well, click on the
well in the Plate diagram and view the gel in the Gel view. To see
the graph for each well, click on the well in the Plate diagram and
view the graph in the Graphs view.
The gel (above) shows the expected peaks marked with colored
lines on the Gel view. The well header is pink if the well meets the
filter criteria for the first filter, and black if it meets the filter criteria
for both the first and second filters.
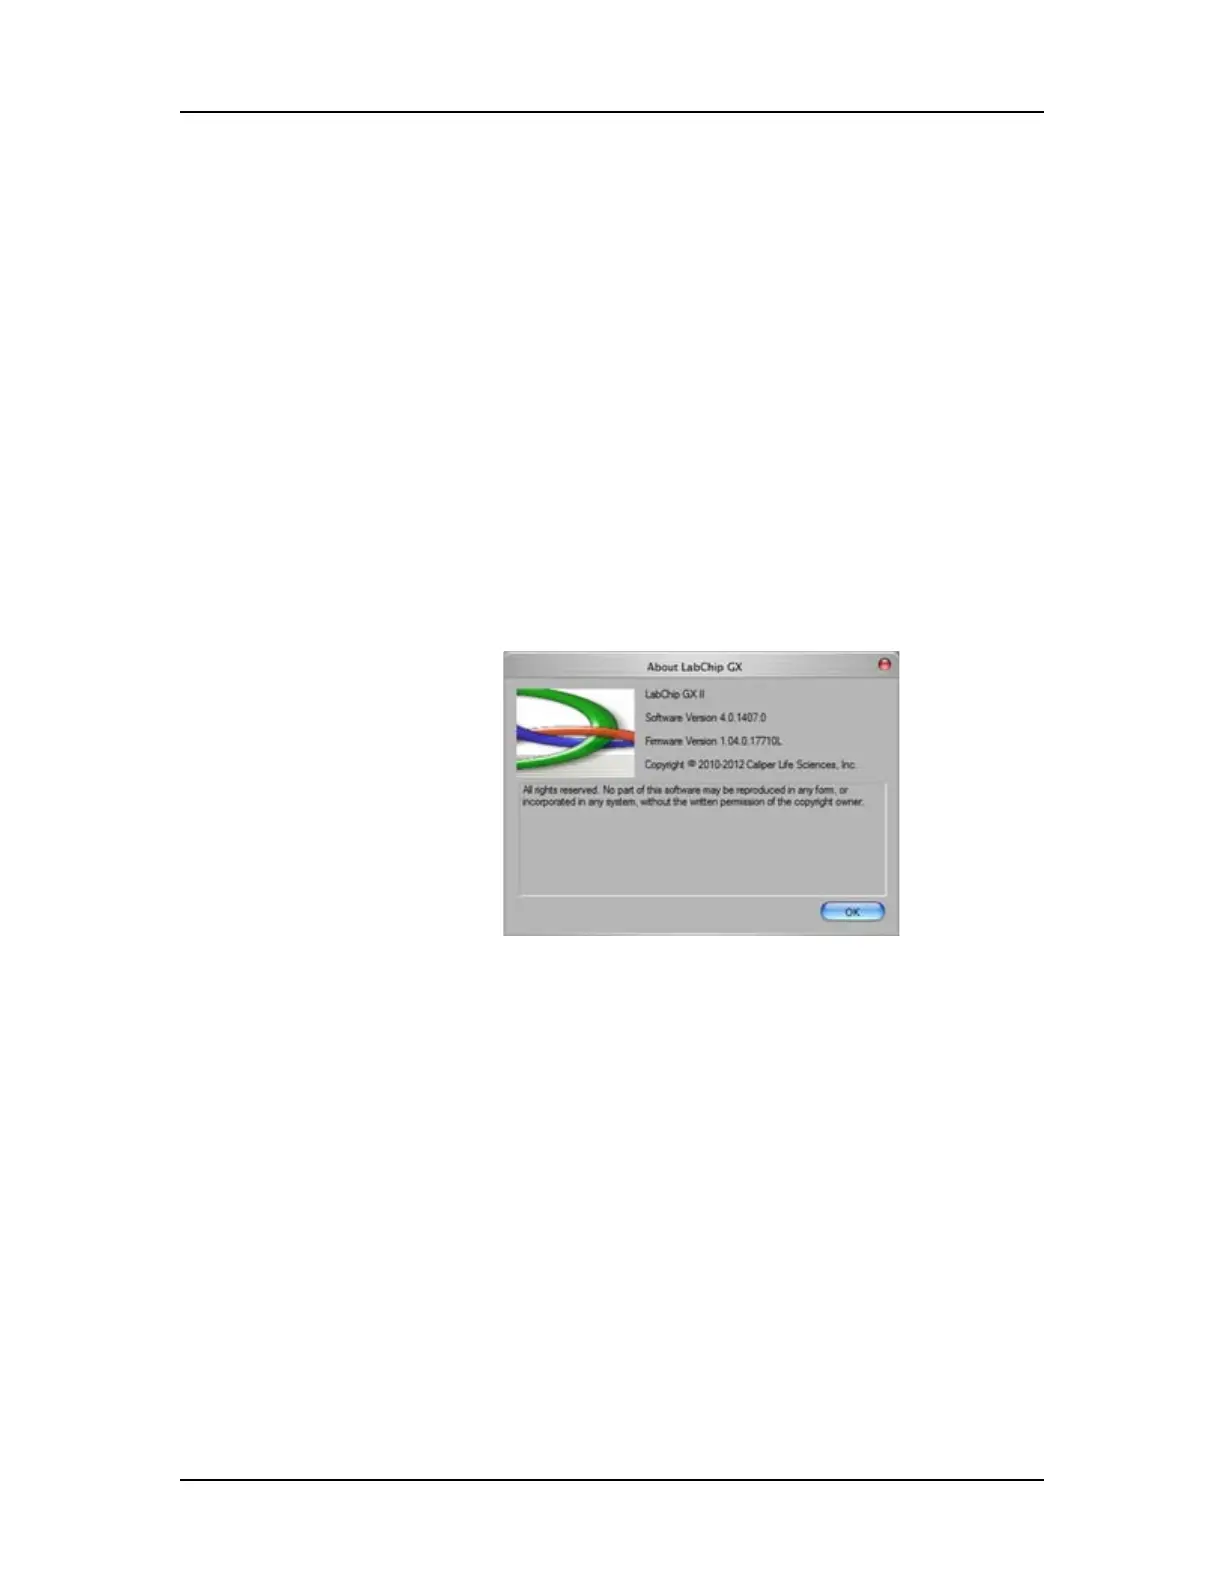
About LabChip GX Window
The About LabChip GX window displays the software and firmware
versions. Selecting About LabChip GX on the Help Menu opens
this window.
Figure 70. About LabChip GX Window

 Loading...


