Data Analysis 58
V4.2 LabChip GX User Manual PerkinElmer
How the Software Analyzes Genomic DNA Data
The Genomic DNA (gDNA) assay analyzes data similar to the other
DNA assays, except that the alignment of the sample data with the
ladder data is based solely on the Lower Marker. To improve the
accuracy of the alignment of the 12 samples between ladders,
gDNA assays use the bracketed alignment described in “How the
Software Analyzes Protein Data” on page 45.
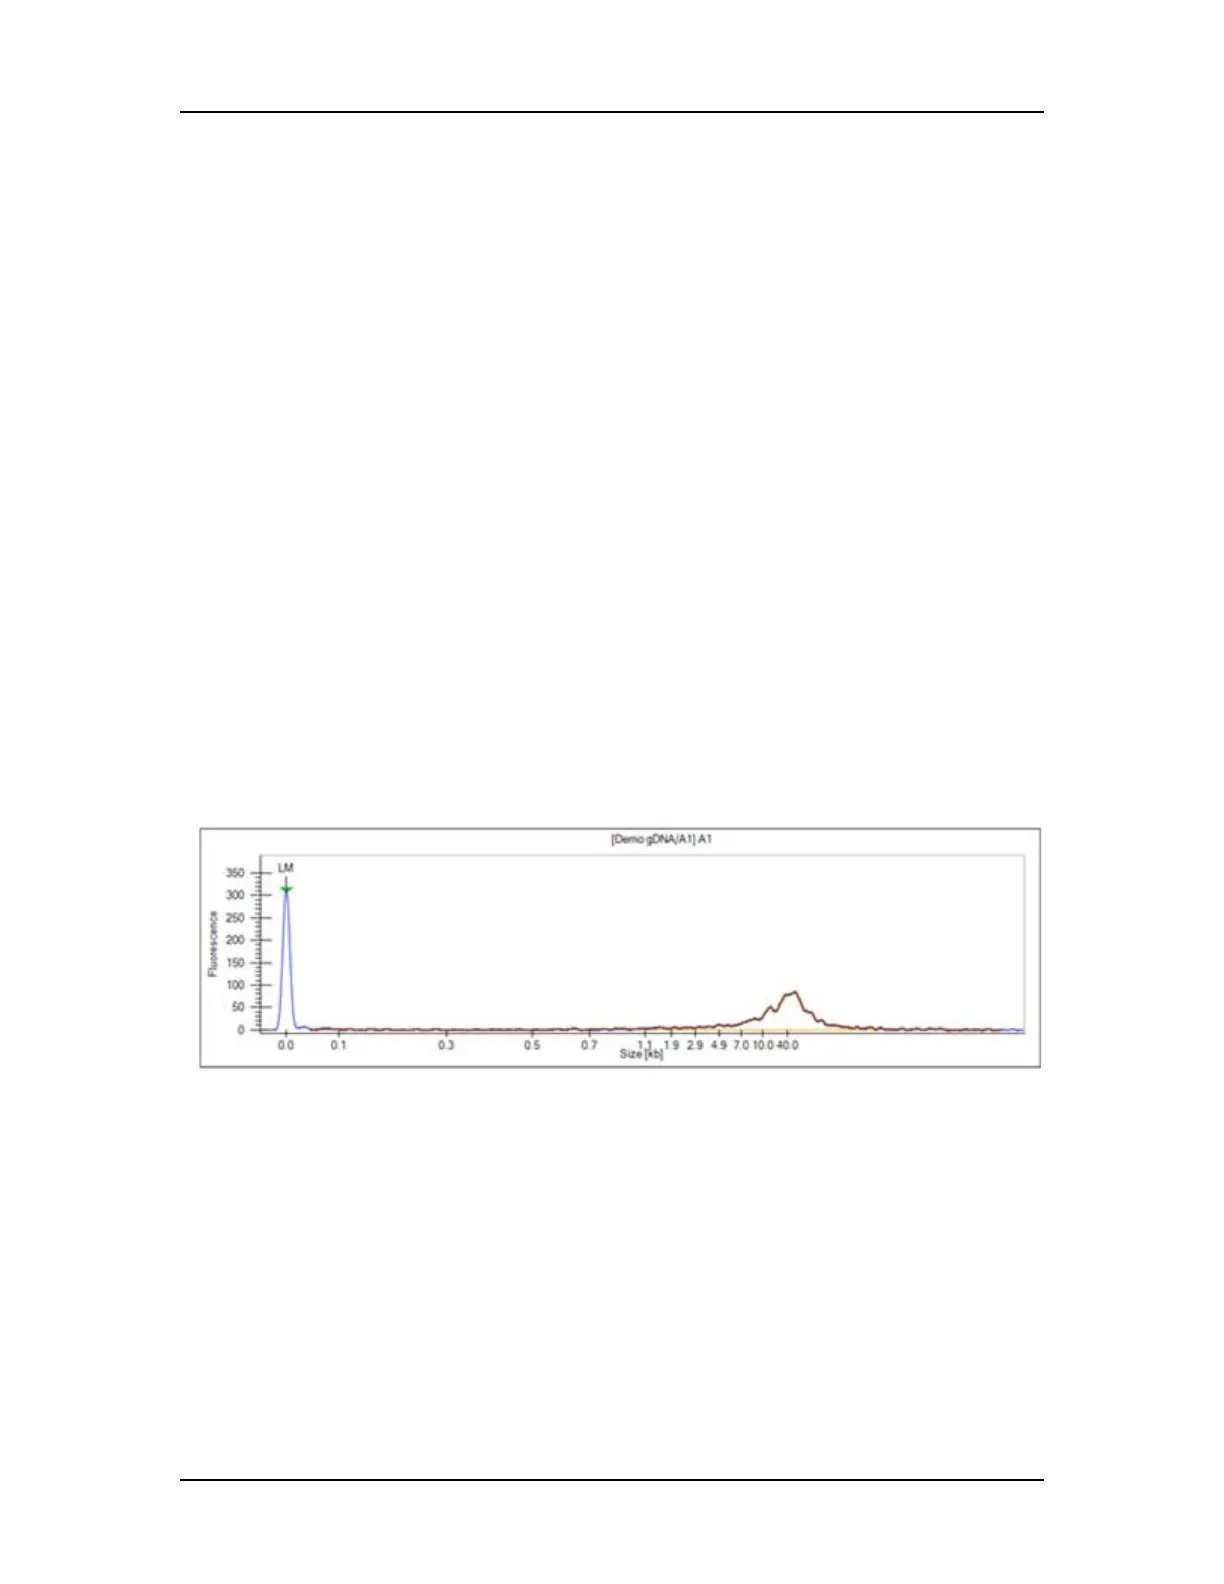
For calculating concentration, the Genomic DNA assay uses a GQS
Smear, starting at 0.175 kb and extending to 300 kb, by default (see
Figure 22). The start size of the gDNA smear can be changed on
the Advanced Tab in the Assay Editor window. The calculation of
concentration is similar to that used for individual peaks, as
described in How the Software Analyzes DNA Data; however, the
GQS Smear is used in place of individual sample peaks, and the
lower marker is used in place of the upper marker to normalize
areas. The Total gDNA Concentration of each sample is reported in
the Well Table.
The Genomic DNA assay also reports a Genomic Quality Score
(GQS) for each sample in the Well Table. The GQS represents the
degree of degradation of a sample, with 5 corresponding to intact
gDNA and 0 corresponding to highly degraded gDNA. The GQS is
calculated using the size distribution of the sample.
Figure 22. Genomic DNA GQS Smear (in orange)

 Loading...


