Data Analysis 69
V4.2 LabChip GX User Manual PerkinElmer
Forcing Expected Peaks
If there are multiple peaks in the tolerance range, the largest peak
is labeled as the expected peak, even if it is not the exact size
specified. If a different nearby peak should have been selected as
the expected peak, you can specify which peak is labeled the
expected peak.
1 In the Graph View, right-click on the peak that should be labeled
as the expected peak.
2 On the shortcut menu, select Force Expected Fragment/Peak
and then select the desired fragment or peak from the menu.
To clear a forced peak and revert to the default expected peak,
right-click on the forced expected peak and select Clear Forced
EP.
Viewing the EFs/EPs/EGs in the Graph View
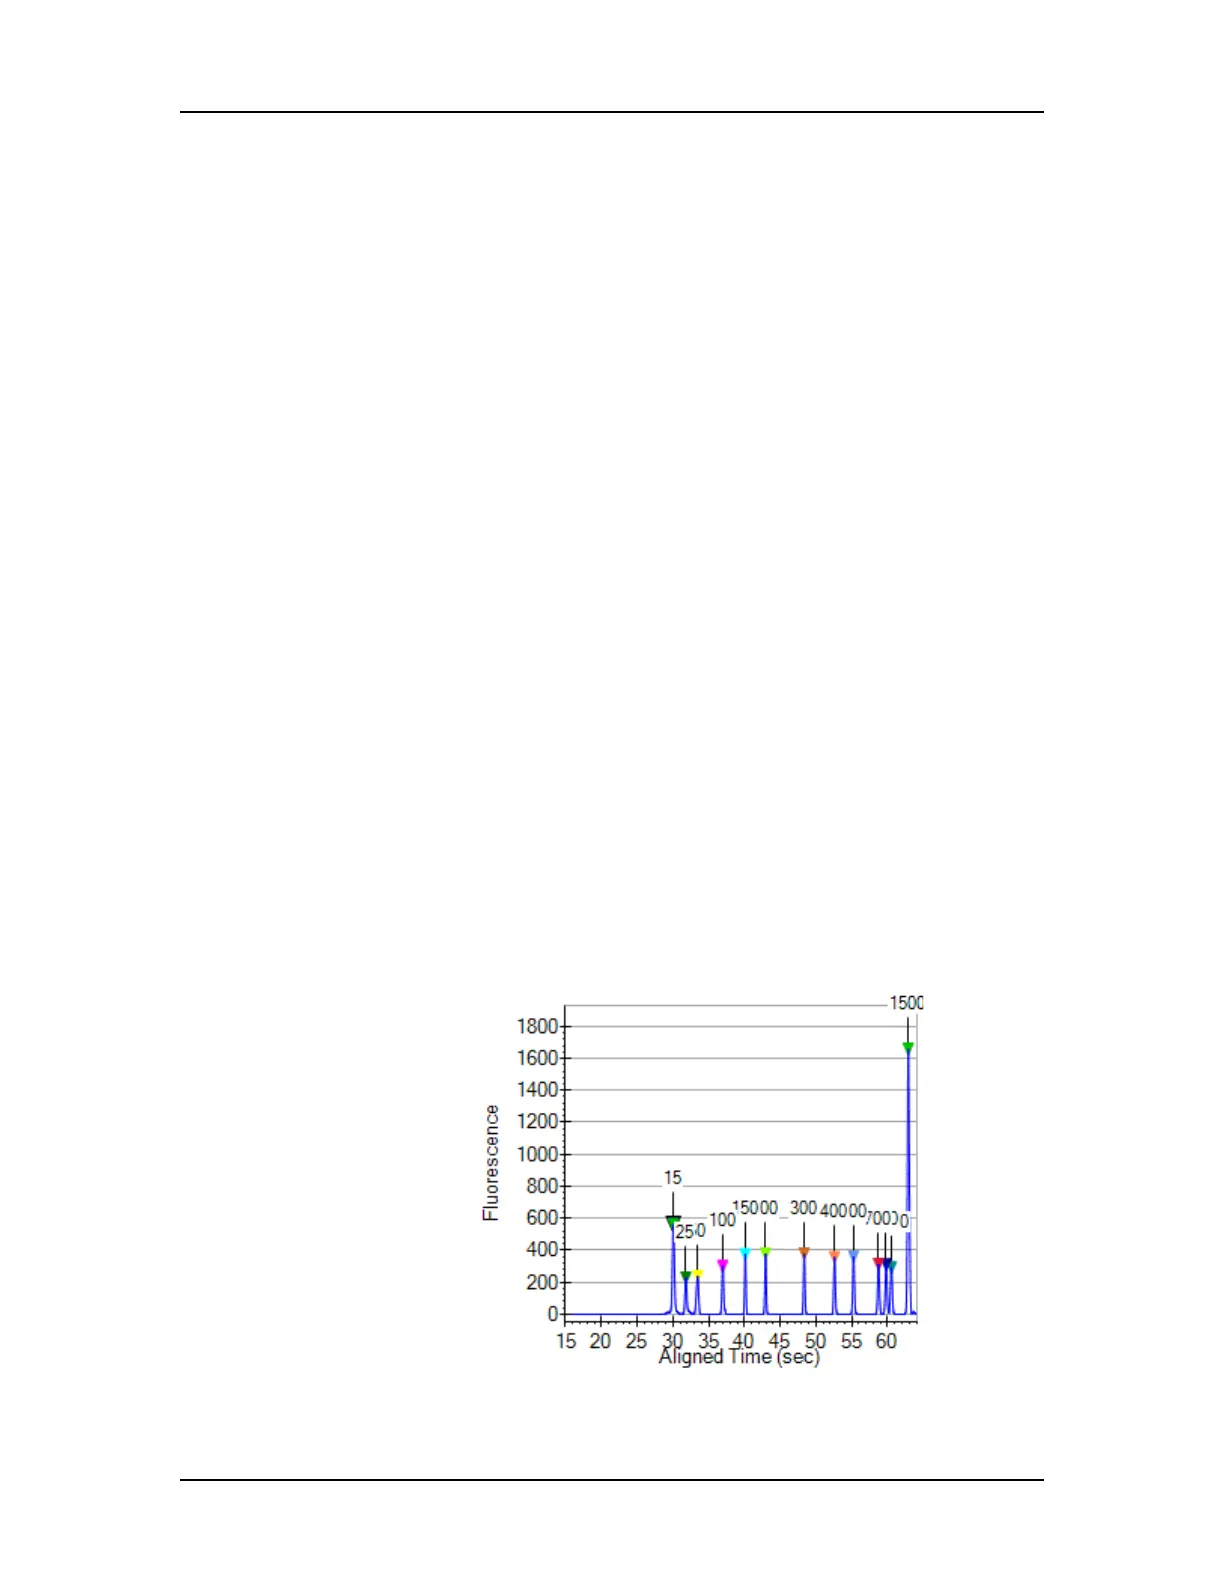
Expected Fragments, Expected Proteins, and Expected
Glycans are identified in the electropherogram by open triangles
over the peaks. The triangles are the same color as specified in the
Expected Fragments/Proteins/Glycans Tab.
To display the expected peak indicators in the Graph view:
1 Click the Properties tab on the right side of the Graph view to
open the Graph View Properties.
2 To view the size of all expected peaks, select Expected
Fragments, Expected Proteins, or Expected Glycan in one of
the Annotation list boxes.
Figure 25. Expected Fragments

 Loading...


