Data Analysis 90
V4.2 LabChip GX User Manual PerkinElmer
To add samples to the Overlay Electropherograms Tab, Ctrl +
click on the sample that you want to add in the Plate View or Plate
List, Gel View, Well Table View, or Peak Table View. Selected wells
are identified by: dashed outlines around the selected gel lanes in
the Gel view, light blue wells in the Plate view, and dark gray rows in
the Well Table view and Peak Table view.
To remove a specific sample from the graph, Ctrl + click on the
sample that you want to remove in the Plate View or Plate List, Gel
View, Well Table View, or Peak Table View.
To display only one sample in the Overlay Electropherograms tab,
click on one sample in the Plate View or Plate List, Gel View, Well
Table View, or Peak Table View.
To view the point coordinates and size of the position of the
cursor, hold down the CTRL or Shift key and move the cursor over
the graph.
To view the point coordinates and slope of a point on the trace,
hold down the ALT key and the CTRL key and move the cursor over
the trace.
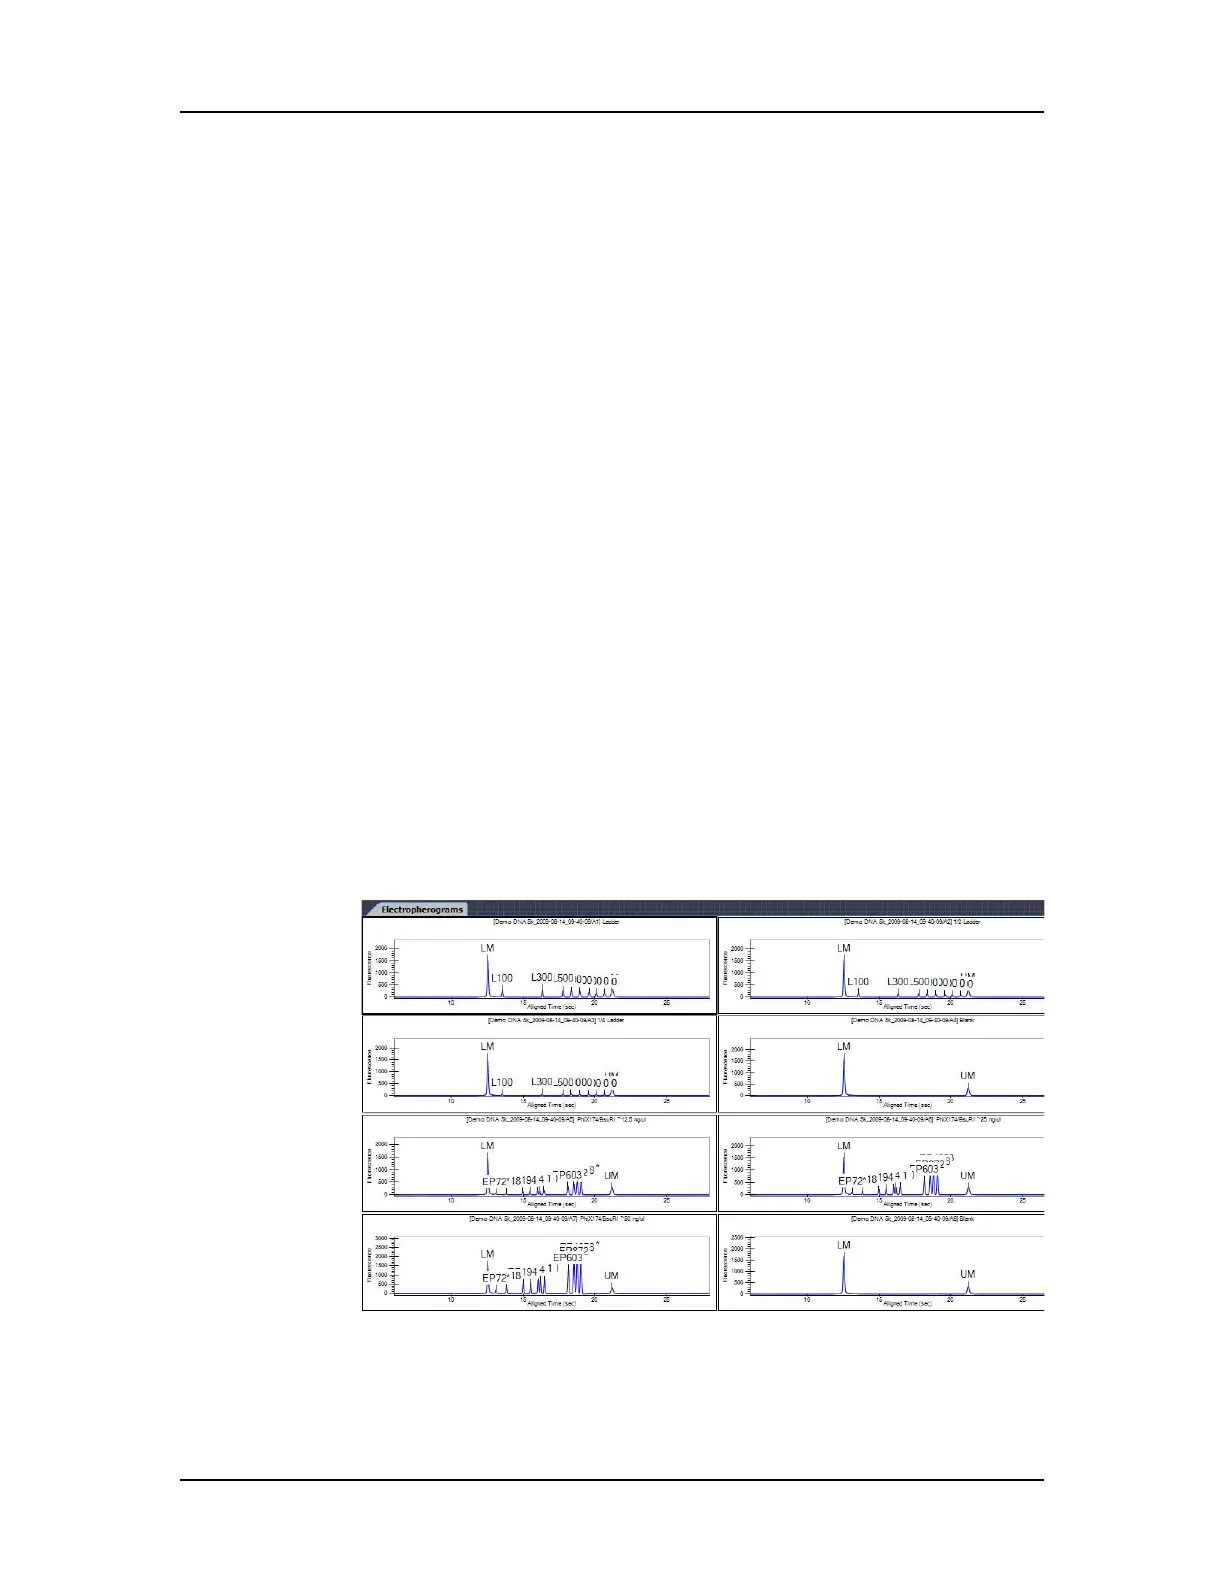
Viewing Graphs in the Electropherograms Tab
If the Electropherograms Tab is not open, select Collection
Layout on the LabChip GX Main Window, select the location where
you want to display the Electropherograms tab, and click the Apply
button. The Electropherograms tab opens.
Figure 37. Electropherograms Tab with Multiple Graphs

 Loading...


