Data Analysis 70
V4.2 LabChip GX User Manual PerkinElmer
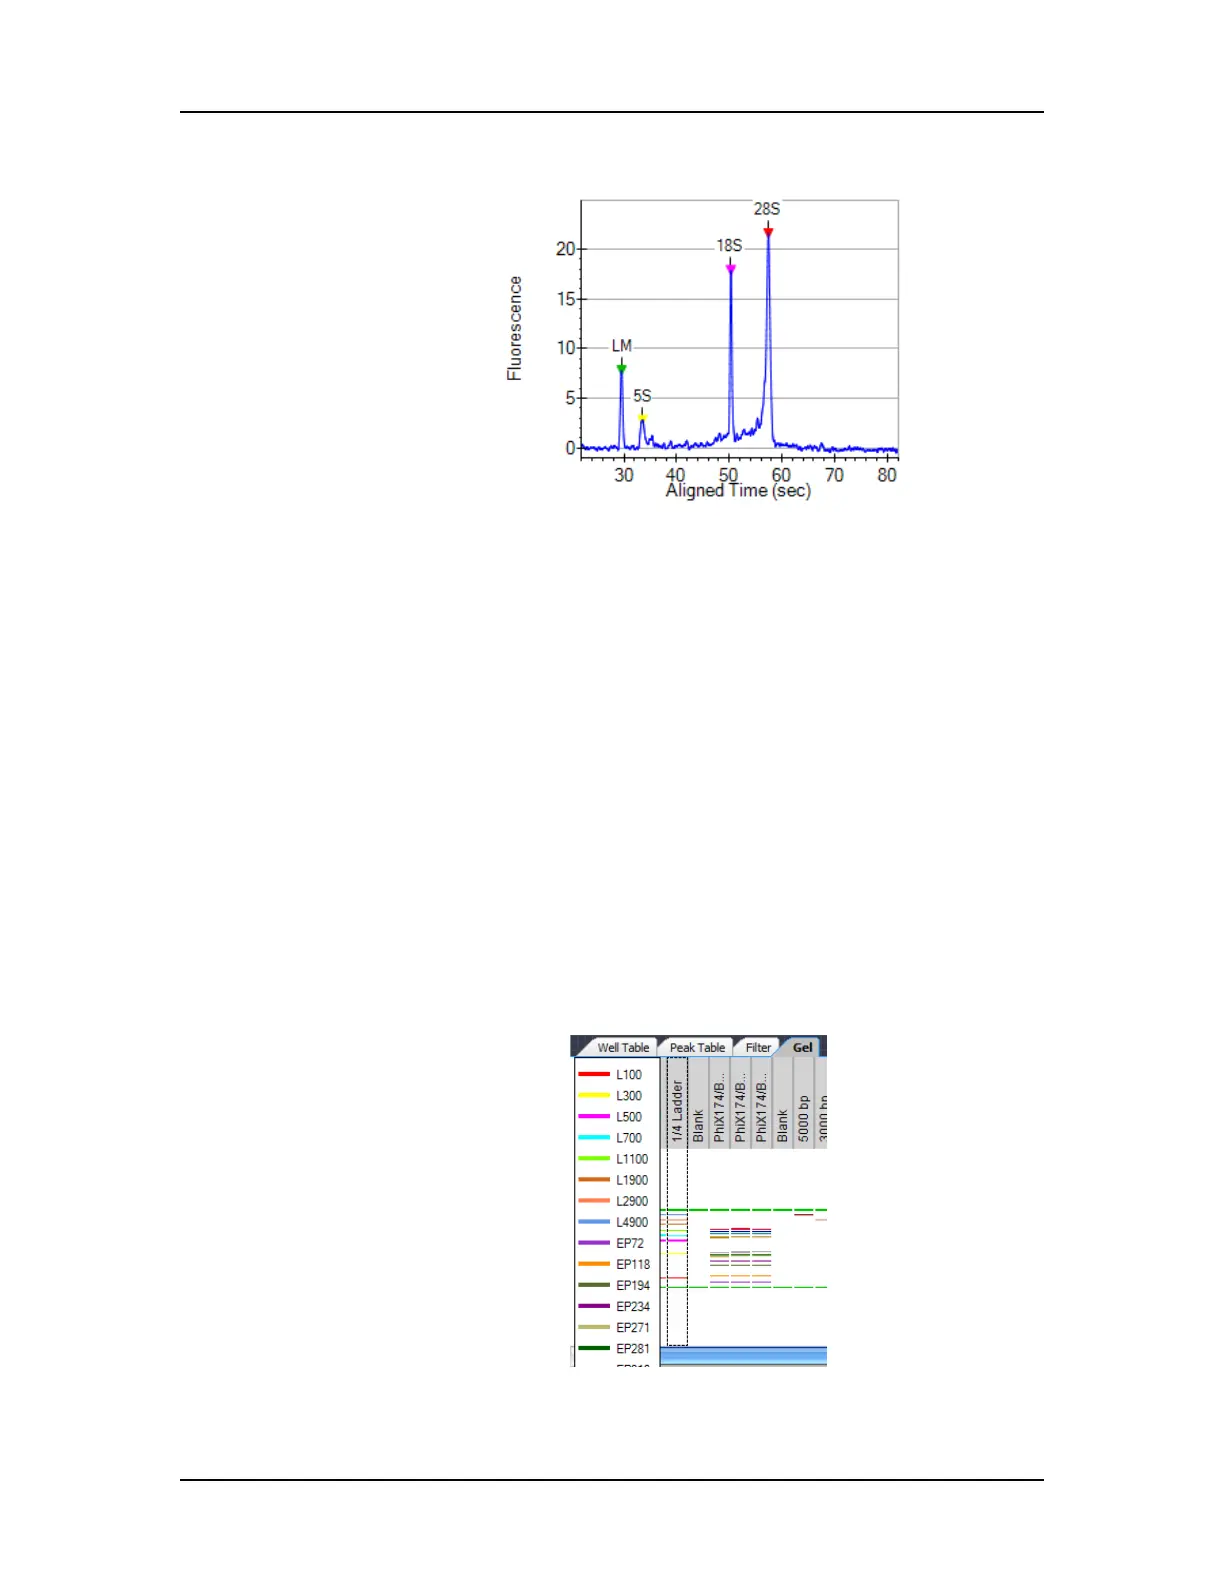
Figure 26. Expected Peaks
Viewing the EFs/EPs/EGs in the Gel View
Expected Fragments/Proteins/Glycans are indicated in the Gel
View by colored lines. The color of the line matches the color
specified in the Expected Fragments/Proteins/Glycans Tab.
To display the expected peaks in the Gel View:
1 Click the Properties tab on the right side of the Gel View to
open the Gel View Properties.
2 Select the Show Expected Peaks check box.
To display the legend that identifies the colors and sizes of the
expected peaks:
1 Click the Properties tab on the right side of the Gel View to
open the Gel View Properties.
2 Select the Show Expected Peaks Legend check box.
Figure 27. Expected Peaks Legend
 Loading...


