Software Reference 164
V4.2 LabChip GX User Manual PerkinElmer
Graph View Properties
To view the Properties for the Electropherograms Tab or the
Overlay Electropherograms Tab, click the Properties tab on the
right side of the Graph View.
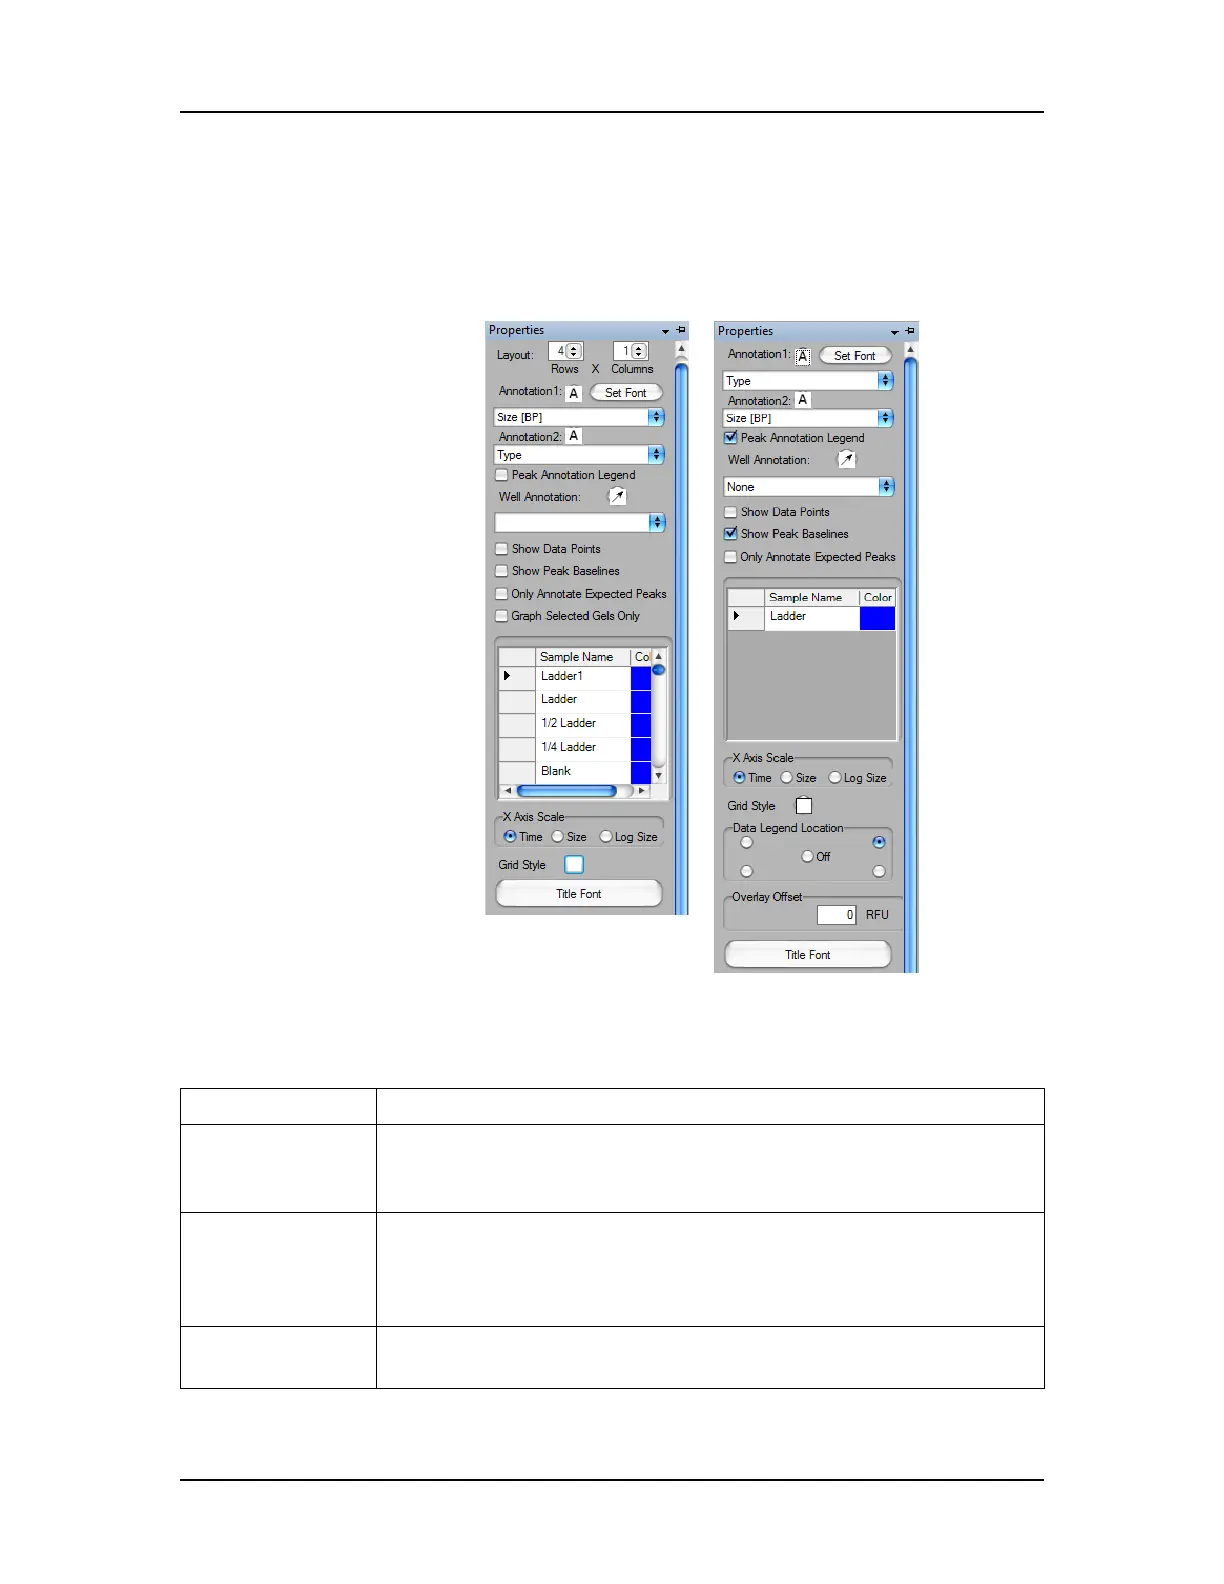
Figure 61. Electropherograms Properties and Overlay
Electropherograms Properties
This window contains the following options:
Option Function
Layout Specifies the number of rows and columns of graphs displayed
on the Electropherograms Tab. (Only displayed when the
Electropherograms tab is selected.)
Annotation 1 Labels each peak in the graph with the peak property selected
from the drop down list. Default is Type.
The Annotations available depend on the columns selected in
the Peak Table View.
Text Orientation
(A) button
Specifies the orientation of the text for the annotation: horizontal,
vertical up, or vertical down.
 Loading...


