Software Reference 162
V4.2 LabChip GX User Manual PerkinElmer
Overlay Electropherograms Tab
Use the Overlay Electropherograms tab on the Graph View to view
a single graph or multiple graphs overlaid on top of each other.
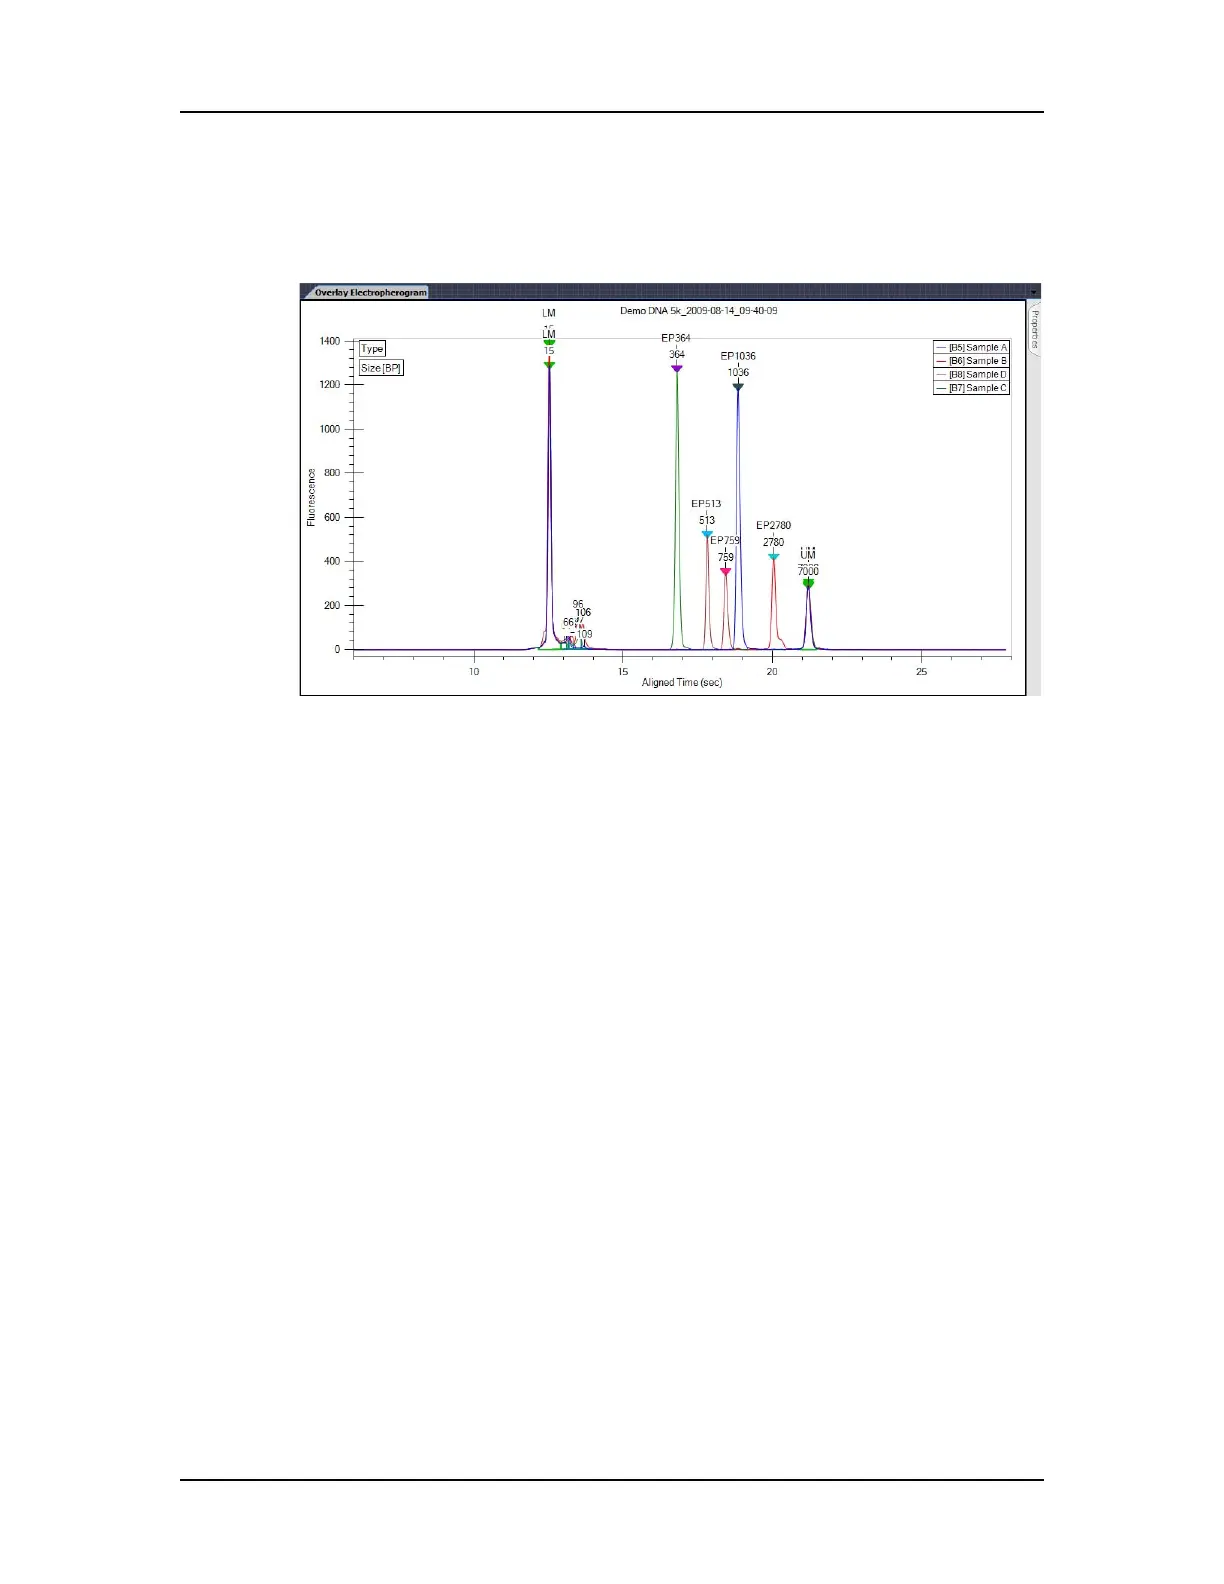
Figure 59. Overlay Electropherograms Tab
The sample list at the upper right displays the name of each sample
and the color assigned to the graph for each sample. If only one
graph is displayed, the Gel View, Well Table View, and Plate View
or Plate List all show the same selected well.
The gel lanes selected in the Gel View are synchronized with the
graphs displayed in the Overlay Electropherograms tab.
For information on changing the view in the Overlay
Electropherograms tab, see “Viewing Graphs in the Overlay
Electropherograms Tab” on page 89.
See “Graph View Properties” on page 164 for descriptions of the
properties that can be set for the Overlay Electropherograms tab.
 Loading...


