Data Analysis 71
V4.2 LabChip GX User Manual PerkinElmer
Viewing the EFs/EPs/EGs in the Well Table
A column is added to the Well Table for each Expected Peak
entered in the Expected Fragments/Proteins/Glycans Tab. The
column displays the property selected in the Property Displayed in
Well Table list in the Assay Analysis Window.
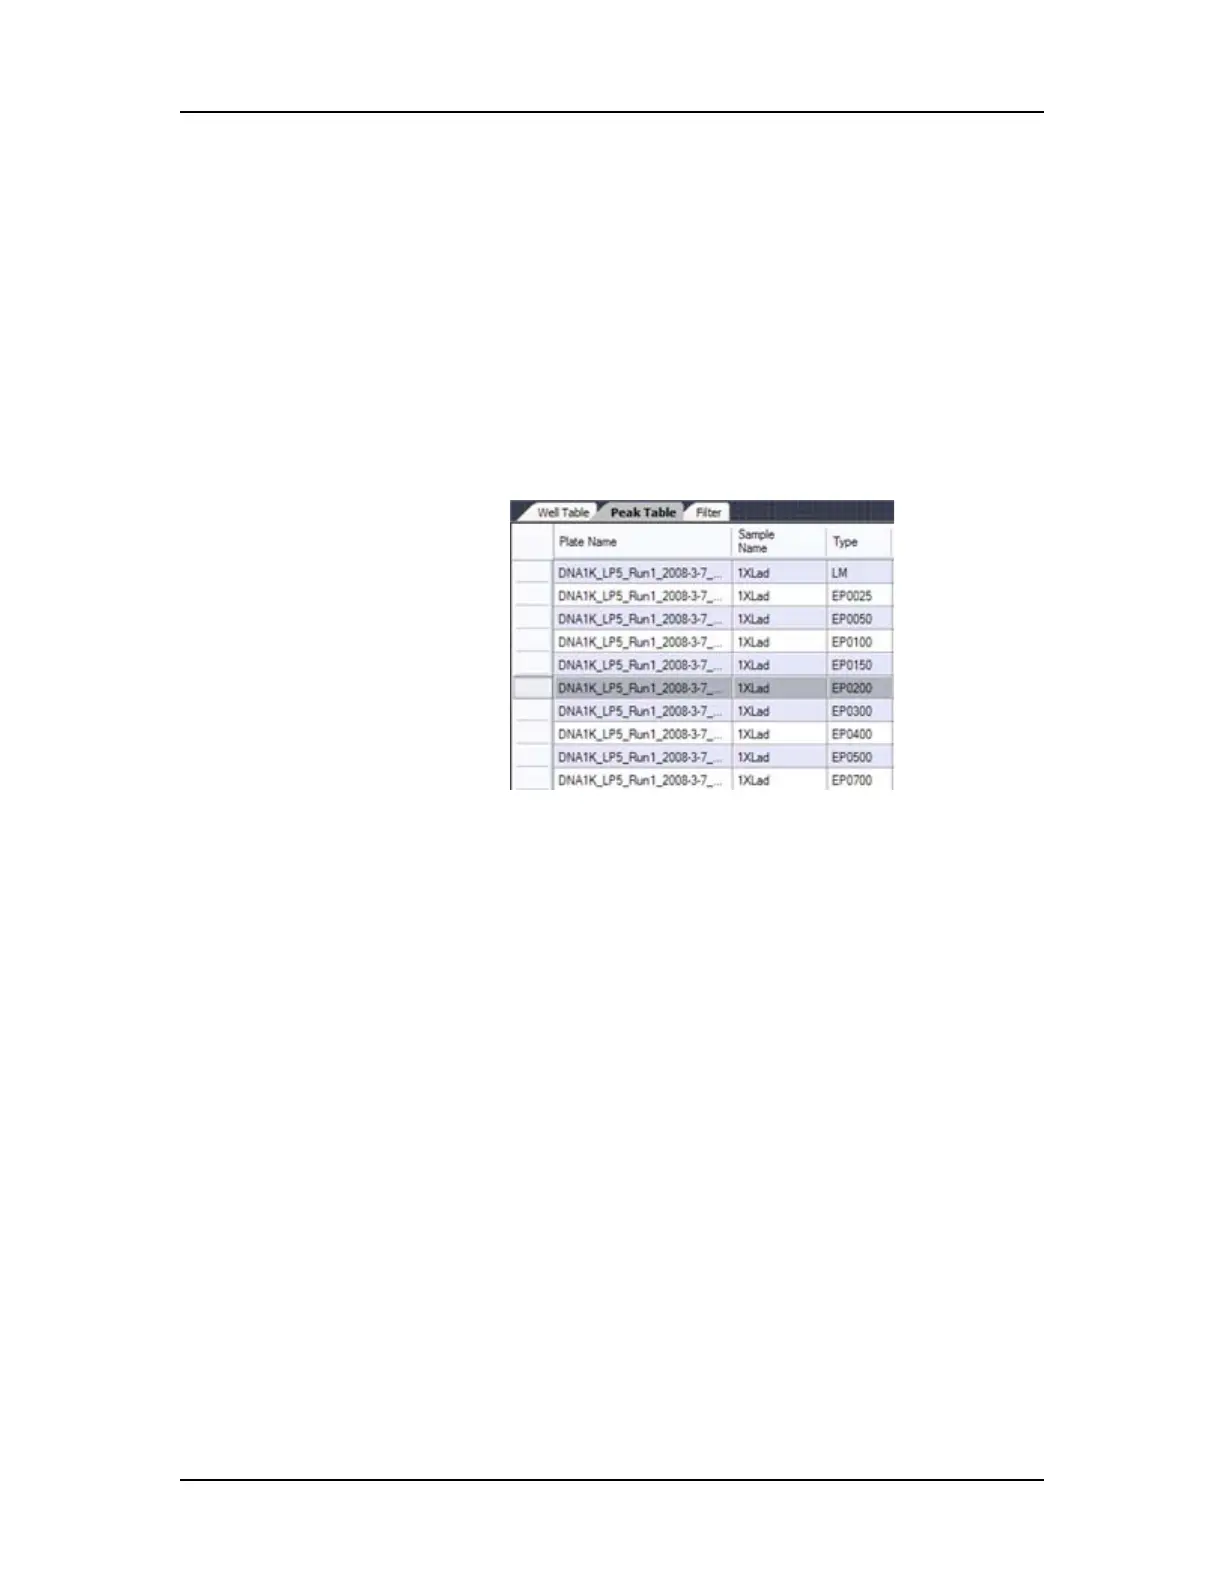
Viewing the EFs/EPs/EGs in the Peak Table
Expected Fragments, Expected Proteins, and Expected
Glycans are identified in the Peak Table with the peak name
displayed in the Type column.
Figure 28. DNA Assay Peak Table

 Loading...


