Software Reference 189
V4.2 LabChip GX User Manual PerkinElmer
Alignment Tab (Continued)
• Align Well Groups to Specified Ladders - If selected, each
row is aligned with the ladder selected in the table.
Markers - Displays the markers that are used for alignment. This
setting is determined by the assay type and cannot be modified.
Ladder Rejection Threshold - Specifies the minimum Ladder
Quality Score required to accept a ladder. If a ladder is below this
threshold, the ladder is flagged as an error well and is not used for
sizing or quantization. Set the value to 0 to turn off this feature.
To view the unaligned data (spike rejected, filtered, and baseline
corrected), select Turn Off Analysis from the Analysis menu.
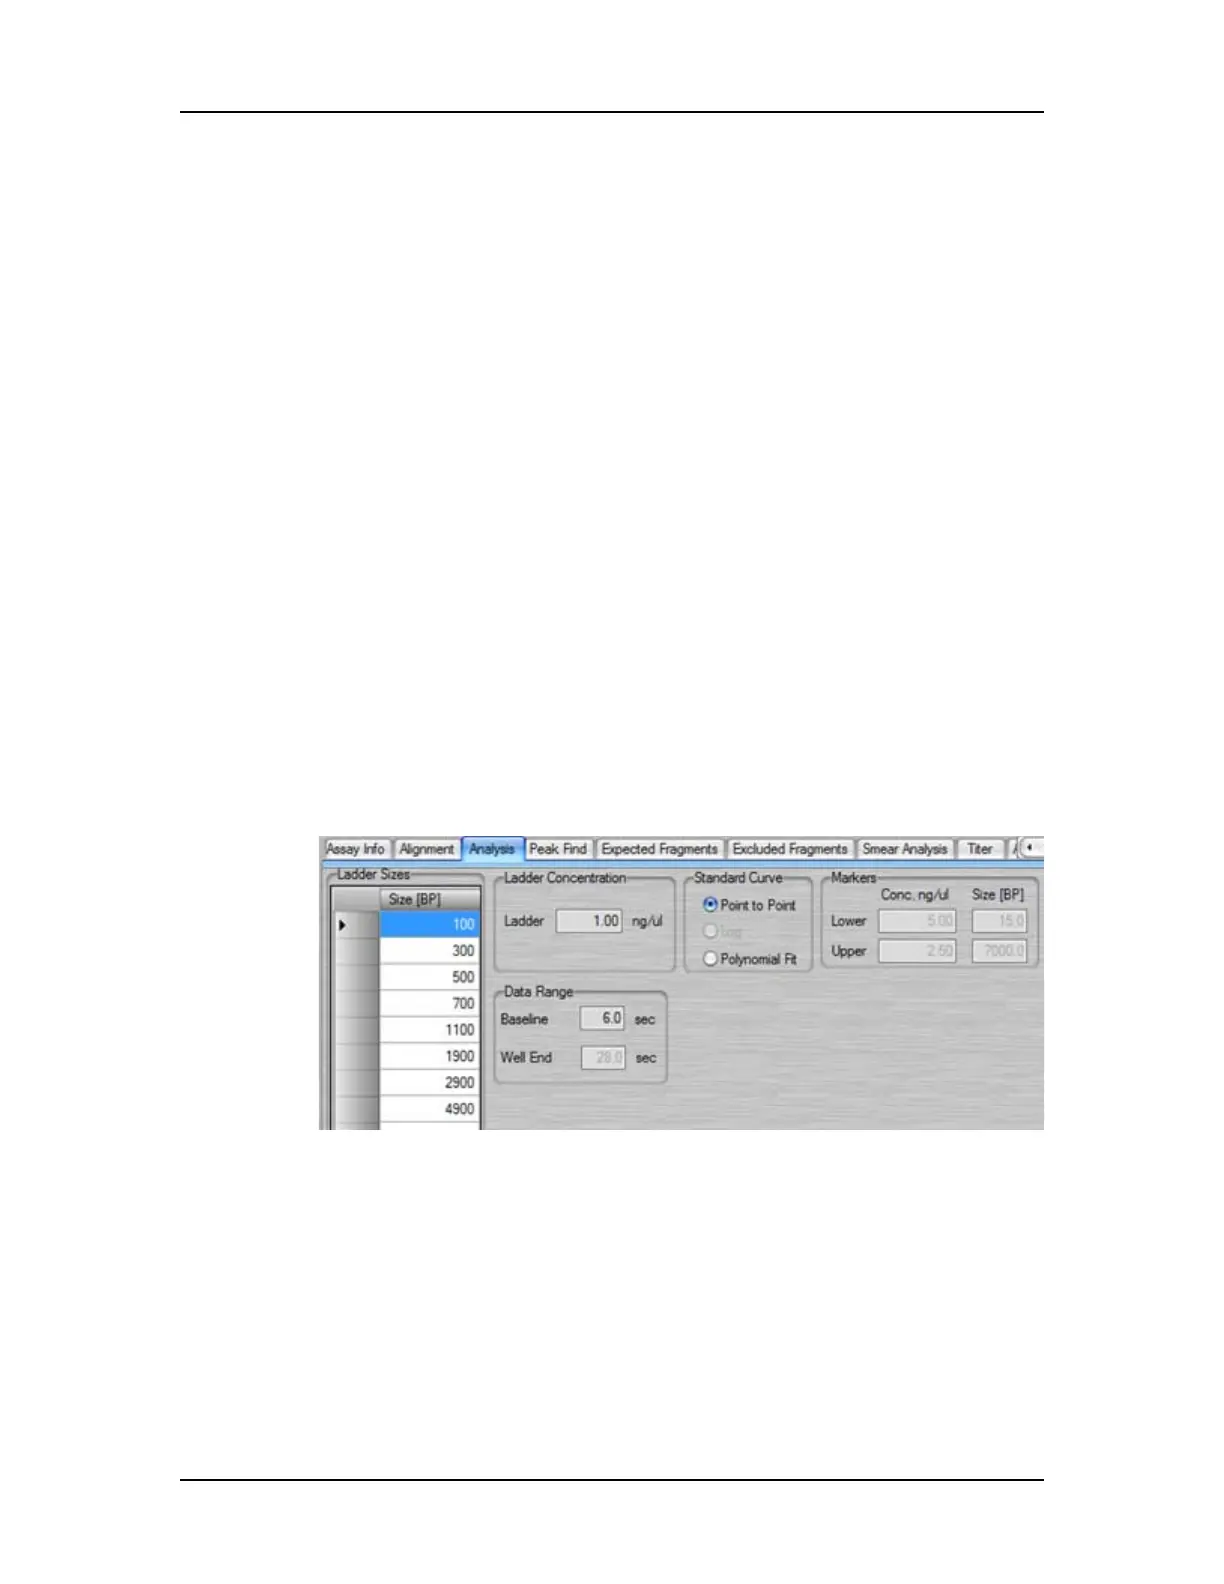
Analysis Tab
Use the Analysis tab on the Assay Analysis Window to view the
Upper and/or Lower marker peak designation (this setting cannot
be changed) or to view or change the Ladder Sizes, Ladder
Concentration, Standard Curve (not available for CZE assays), Data
Range, Marker Concentration (DNA) Dilution Ratio (Protein), and
System Peak Exclusion (Protein). Protein Charge Variant assays
only show the Data Range. (Protein, Glycan, and Protein Charge
Variant assays are only supported on LabChip GX II instruments.)
Figure 75. Assay Analysis Window - Analysis Tab
Ladder Sizes
A table showing the sizes of the ladder peaks in bp (base pairs) for
DNA, kDa (kiloDaltons) for protein, nt (nucleotides) for RNA, or kb
(kilo base pairs) for gDNA assays. Click in the Size column and type
the desired size to change the ladder size. (Not available for Protein
Charge Variant assays.)
 Loading...


