Software Reference 167
V4.2 LabChip GX User Manual PerkinElmer
Gel View
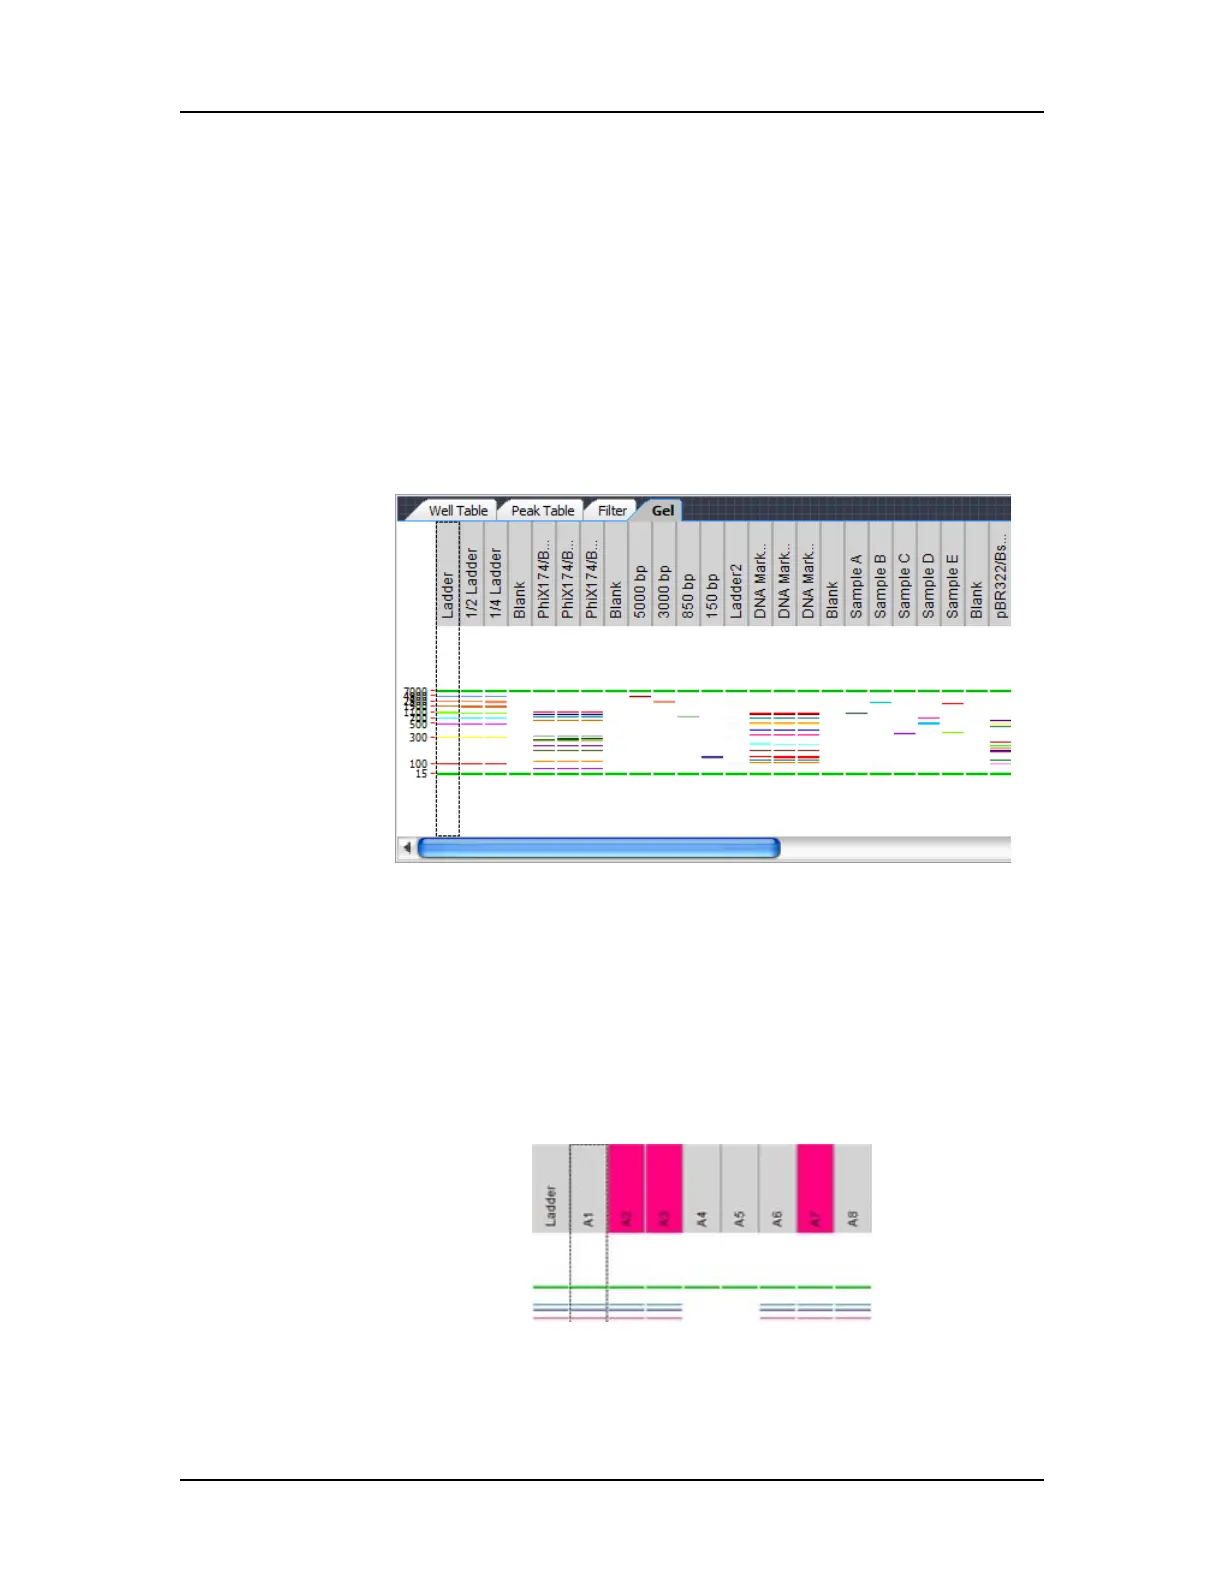
The Gel view in the Collection Pane is a visual representation of the
data formatted to look like the Gel slabs that were originally used to
provide DNA, Protein, or RNA data. The data is shown in Time vs.
Fluorescence (or digital form). (Protein, Glycan, and Protein Charge
Variant assays are only supported on LabChip GX II instruments.)
Click on a gel lane (well) to select the well. Ctrl + click to select
multiple wells. Selected wells are outlined with a dotted gray line.
Wells selected in the Gel view are also selected in the Well Table
View and are displayed in the Overlay Electropherograms Tab.
Figure 62. Gel View
Moving the cursor over a band in the Gel view displays a tool tip
that includes the same information about the peak as the Peak
Table View. (Changing the columns displayed in the Peak Table will
change the contents of the tool tip in the Gel view.)
For DNA assays, the upper and lower markers of all wells are
aligned to the upper and lower markers of the first well in the gel
view. For Protein and RNA assays, the lower markers of all wells
are aligned to the markers of the first well in the gel view.
Figure 63. Gel Headers
 Loading...


