Software Reference 179
V4.2 LabChip GX User Manual PerkinElmer
Peak Table Properties
To view the Peak Table Properties, click the Properties tab on the
right side of the Peak Table View.
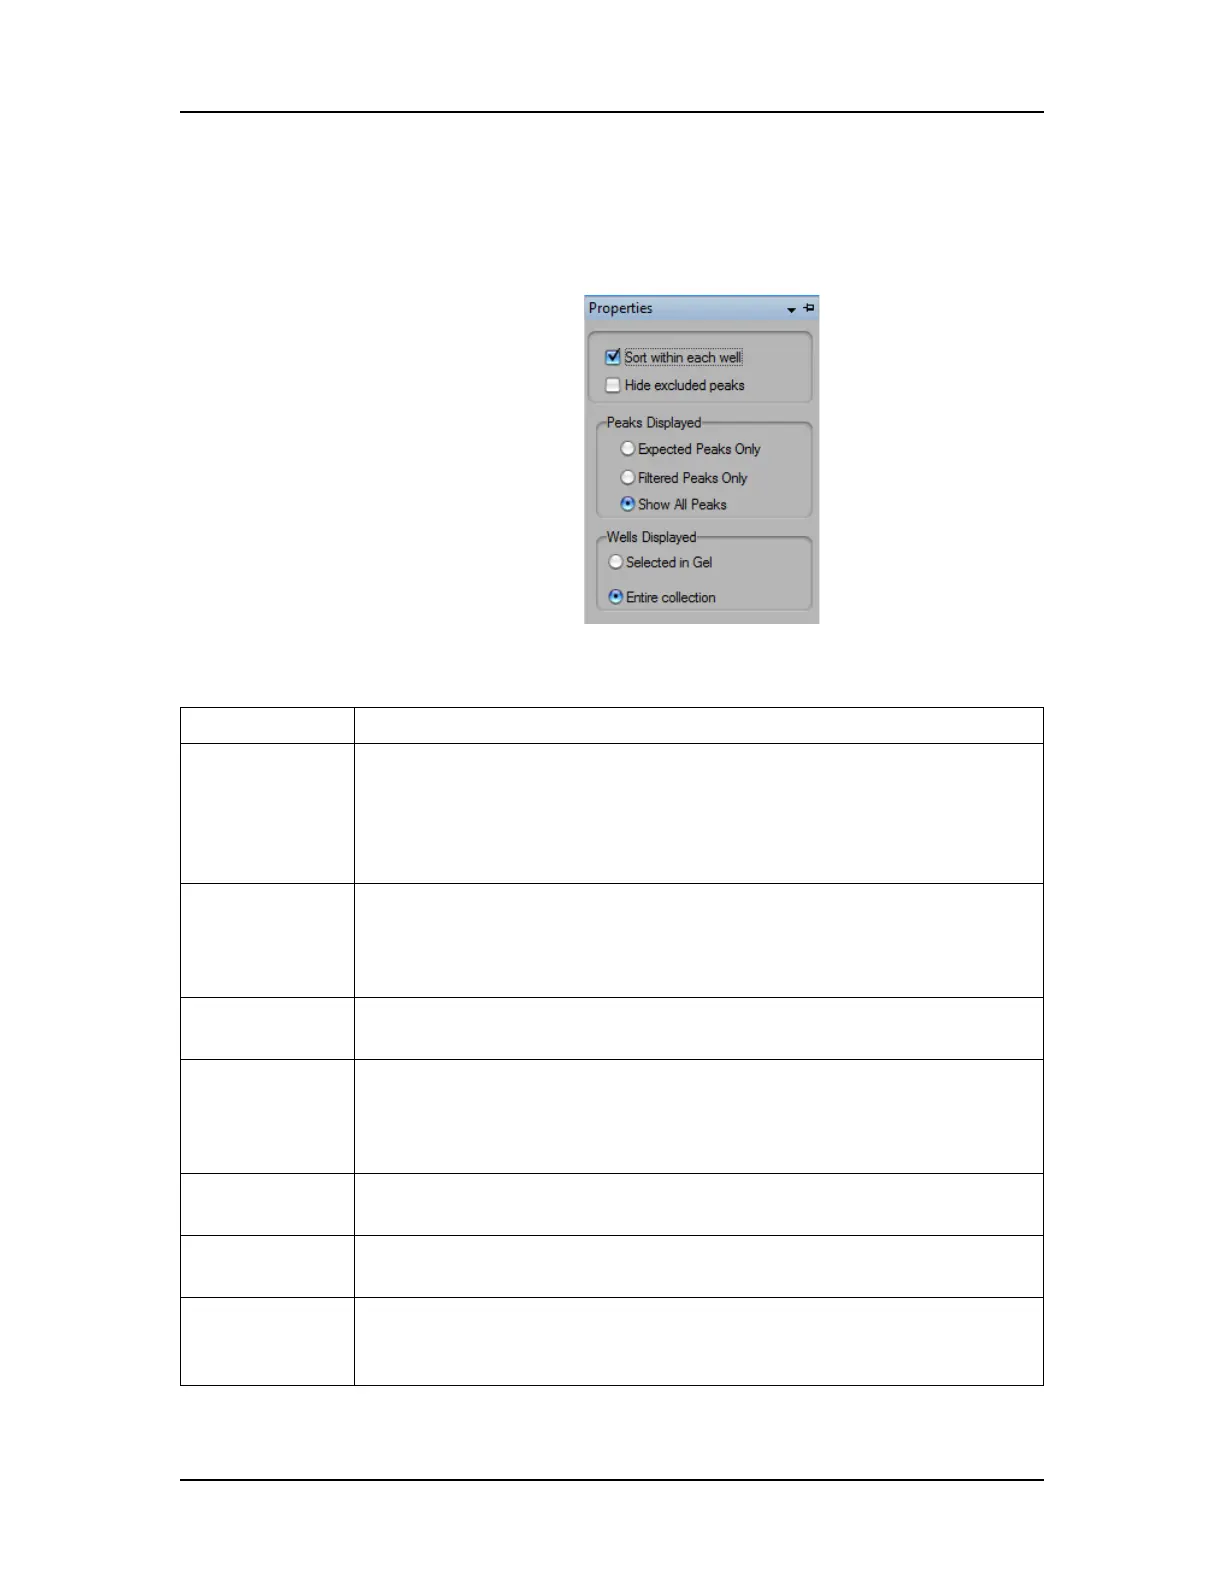
Figure 68. Peak Table Properties
This window contains the following options:
Option Function
Sort within
each well
If selected (default), sorting occurs only within each well rather
than across the entire table. Click a column header to sort the
table rows by the column value. If cleared, uses conventional
sorting, which mixes together peaks from all wells. Clicking the
column header sorts in ascending/descending/original order.
Hide excluded
peaks
If selected, excluded peaks and unknown peaks are hidden in the
Peak Table view. In protein assays, the analysis excludes system
peaks, which are compounds that are artifacts of the assay
chemistry and not generally of interest.
Expected
Peaks only
If selected, only peaks identified as Expected Peaks display in the
Peak Table.
Filtered peaks
only
If selected, the Peak Table displays only peaks that match the filter
criteria. Useful when generating a collection based on a filter
whose selection criteria are peak specific, such as Area,
Concentration, %Purity, Expected Peaks, and Size.
Selected in Gel If selected, only the gel lanes selected in the Gel View display. To
select multiple wells, Ctrl + click on the lanes in the Gel view.
Entire
Collection
If selected, all wells in all plates that are included in the collection
are displayed.
Pin icon In the top right corner, used to lock in place or unlock the
Properties tab. If locked in place, the Peak Table display panel is
resized to accommodate the tab.

 Loading...


