CAPINTEC, INC. CAPTUS
®
4000e
August 15 TIME ACTIVITY ANALYSIS 12-7
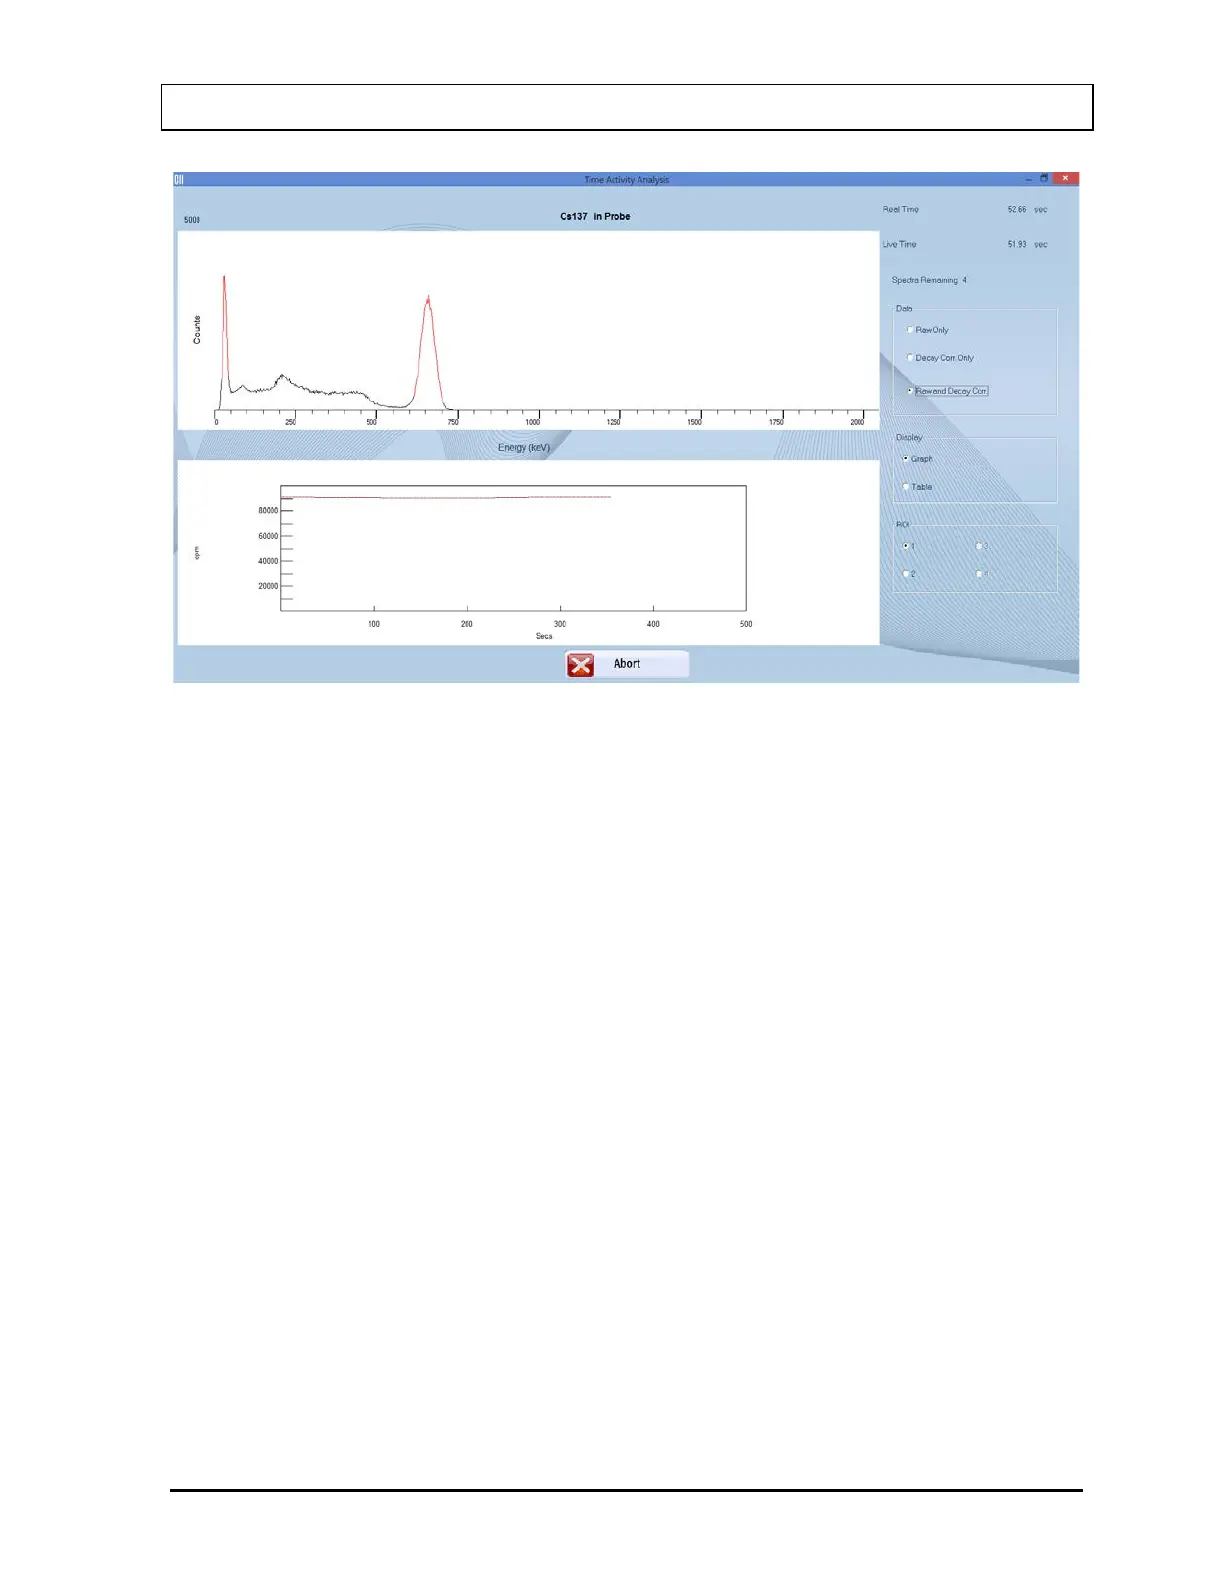
Figure 12-7
4. To stop the counting, select the Abort button or press Alt+A. The collected data is
discarded.
5. After the counting is complete, results are shown in the default Data mode. The data
modes are:
• Raw Only –View raw data only.
• Decay Corr Only –View decay corrected data only.
• Raw and Decay Corr –View both (default).
To change the Data mode, select the appropriate radio button in the Data frame.
The data can be displayed as either a graph (default) or as a table.
• Graph – The data counts collected are displayed as a function of real time. The solid
line represents the Raw data and the dashed line represents the Decay Corrected
data.
• Table – Displays the measured counts in all ROIs in a tabular mode.
To change the Display mode, select the appropriate radio button in the Display frame.
The data can also be displayed over various ROIs (ROI 1 (default), 2, 3, 4). To change
the ROI, select the appropriate radio button in the ROI frame.
6. To print the results, select the Print button or press Alt+P. Raw and decay corrected data
for all ROIs are printed in the table format along with graphs for each ROI.