72
────────────────────────────────────────────────────
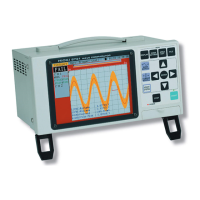
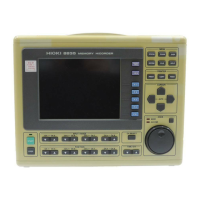
4.4 Processing Functions (Waveform Parameter Processing)
────────────────────────────────────────────────────
90%
10%
Fall time
Rise time
(7) Time to minimum value
・Calculates the time interval from the triggering point to the minimum value
of the waveform (in seconds).
・If there are two minimum value points, the time to the first point is
calculated.
(8) Period
(9) Frequency
・Displays the period (s) and frequency (Hz) of the signal waveform.
・The calculation is performed by determining the middle point of the signal
amplitude and then measuring the interval from the point when that level
is crossed (in rising or falling direction) to the point when it is next crossed.
(10) Rise time
(11) Fall time
・From the captured waveform data, the 0% and 100% level is determined
using the histogram, and the rise time (s) is taken as the time required to
go from 10% to 90% (fall time: from 90% to 10%).
・In the captured waveform data, the first rising slope (or falling slope) is
used to make the calculation.
・If the A/B cursors (vertical, trace) are used, the first rising slope (or falling
slope) within the range defined by the cursors is used.
 Loading...