DMTA-10045-01EN, Rev. E, August 2016
Chapter 6
164
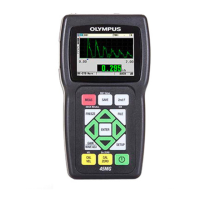
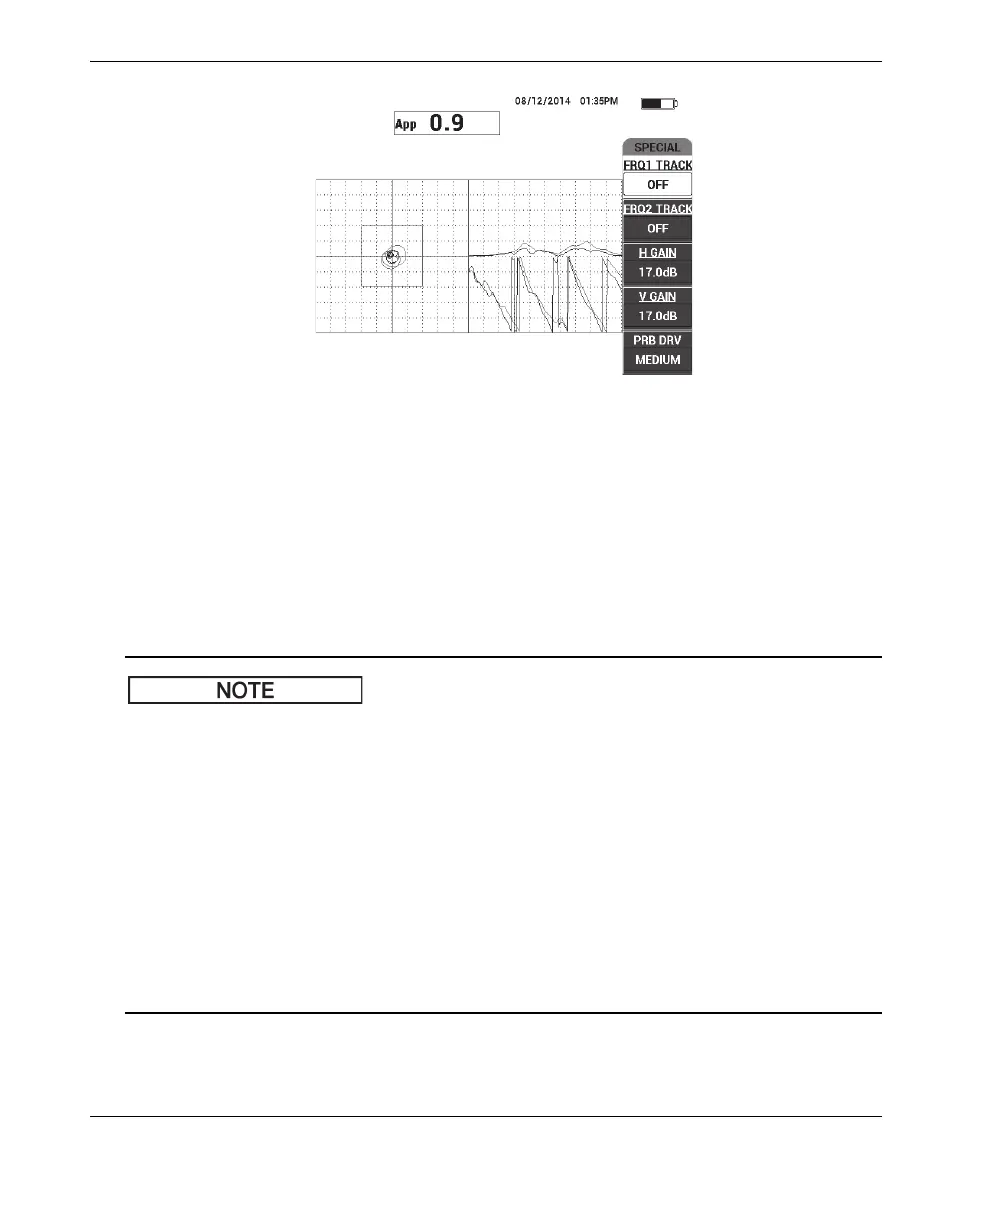
Figure 6‑58 The background reference signal
4. Adjust the FRQ1 TRACK (A key) or FRQ2 TRACK (B key) as necessary, to select
(highlight) up to two specific frequencies.
This is useful for identifying the various peaks observed.
5. Slowly scan over defects, and carefully observe the frequency spectrum (right
view), in particular the amplitude component (top right) [see Figure 6-59 on
page 165].
a) Focus on amplitude difference rather than highest peak. Often, the best
operating frequency is not the one that provides the highest peak, but the one
that provides the highest contrast between a good bond and a defective bond.
b) Try to identify the minimum and maximum useful frequencies; often, only a
smaller portion of the spectrum (usually the lower end) is truly useful. Using
the frequency markers, try to locate the valuable “start frequency” and “end
frequency” values.
c) Scan slowly, with a circular motion, because the peaks will vary greatly,
depending on the probe position.
d) Take notes, because working with the spectrum view can be confusing.