DMTA-10045-01EN, Rev. E, August 2016
Applications
165
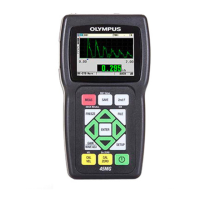
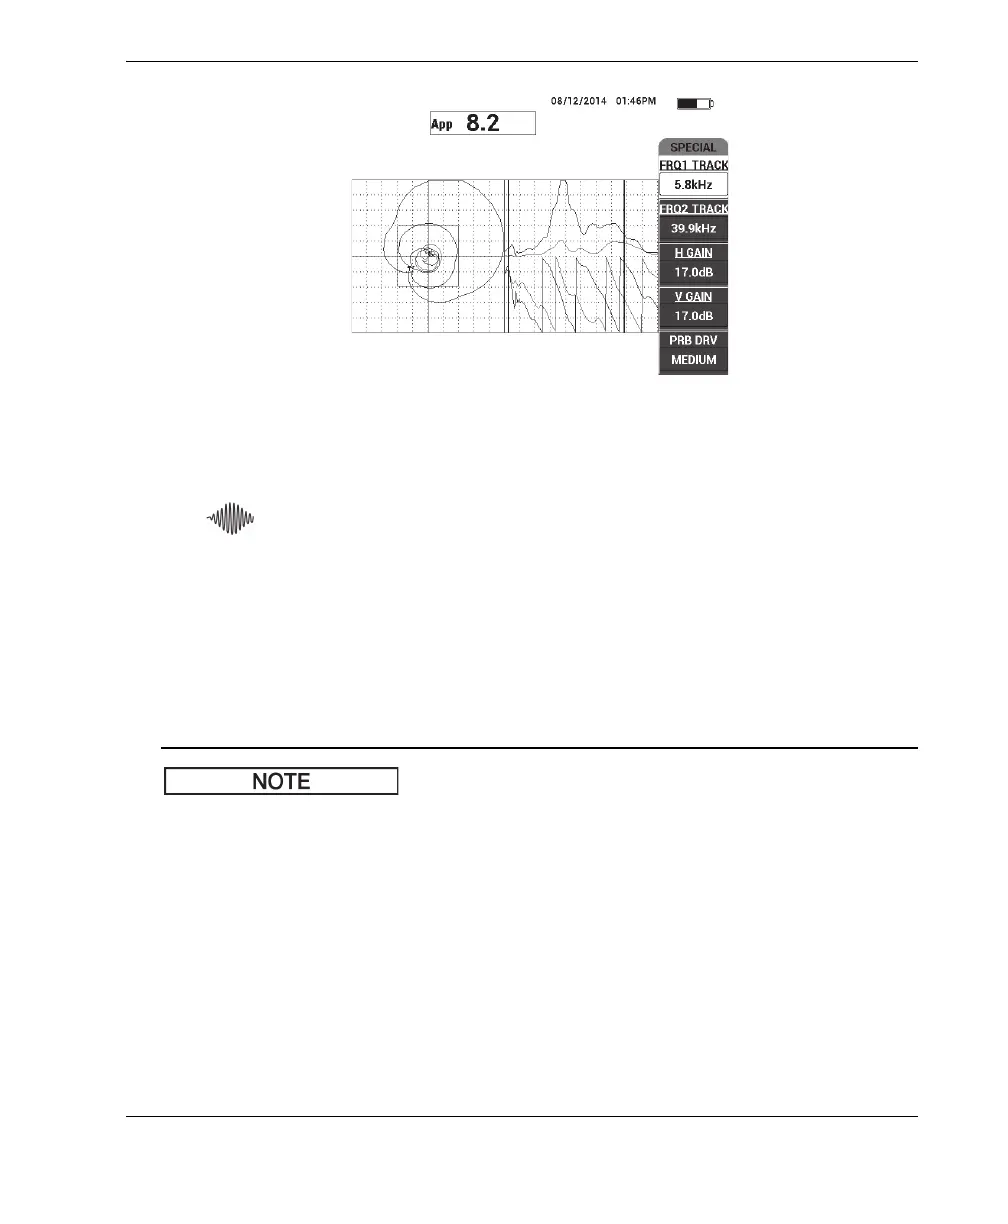
Figure 6‑59 The frequency spectrum view (right side of screen)
6. After you have identified the lower and upper limits, press the MAIN menu key
( ), and then enter these limits as the START FREQ and STOP FREQ values.
Second-Pass Analysis
To focus on the defects (second probe pass)
After you have determined the lower and upper limits of the valuable spectrum,
repeat steps 1–6, but this time focus on the various defects.
a) Scan slowly, using a circular motion.
b) Take notes for every defect, material, frequency evaluated, etc.
c) Try to find common frequencies that enable you to detect the various defects
under various conditions. A “universal” frequency is always better, because it
will simplify the test.
d) The ultimate goal of finding the best test frequencies is to enable you to write
your own (very simple) procedure using the PC RF or IMPULSE method.
e) The frequency tracking feature actually records the live dot position in a
similar way to the pitch-catch RF/IMPULSE mode.