Data Analysis 53
V4.2 LabChip GX User Manual PerkinElmer
How the Software Analyzes RNA Data
(Continued)
11 Assay-defined RNA fragments are identified from the peaks in
the peak table. Fragments are located by finding the largest
peak within a size range associated with the fragment. For
Eukaryote RNA assays, 5S, 18S and 28S fragments are
located. For Prokaryote assays, 5S, 16S and 23S fragments are
identified.
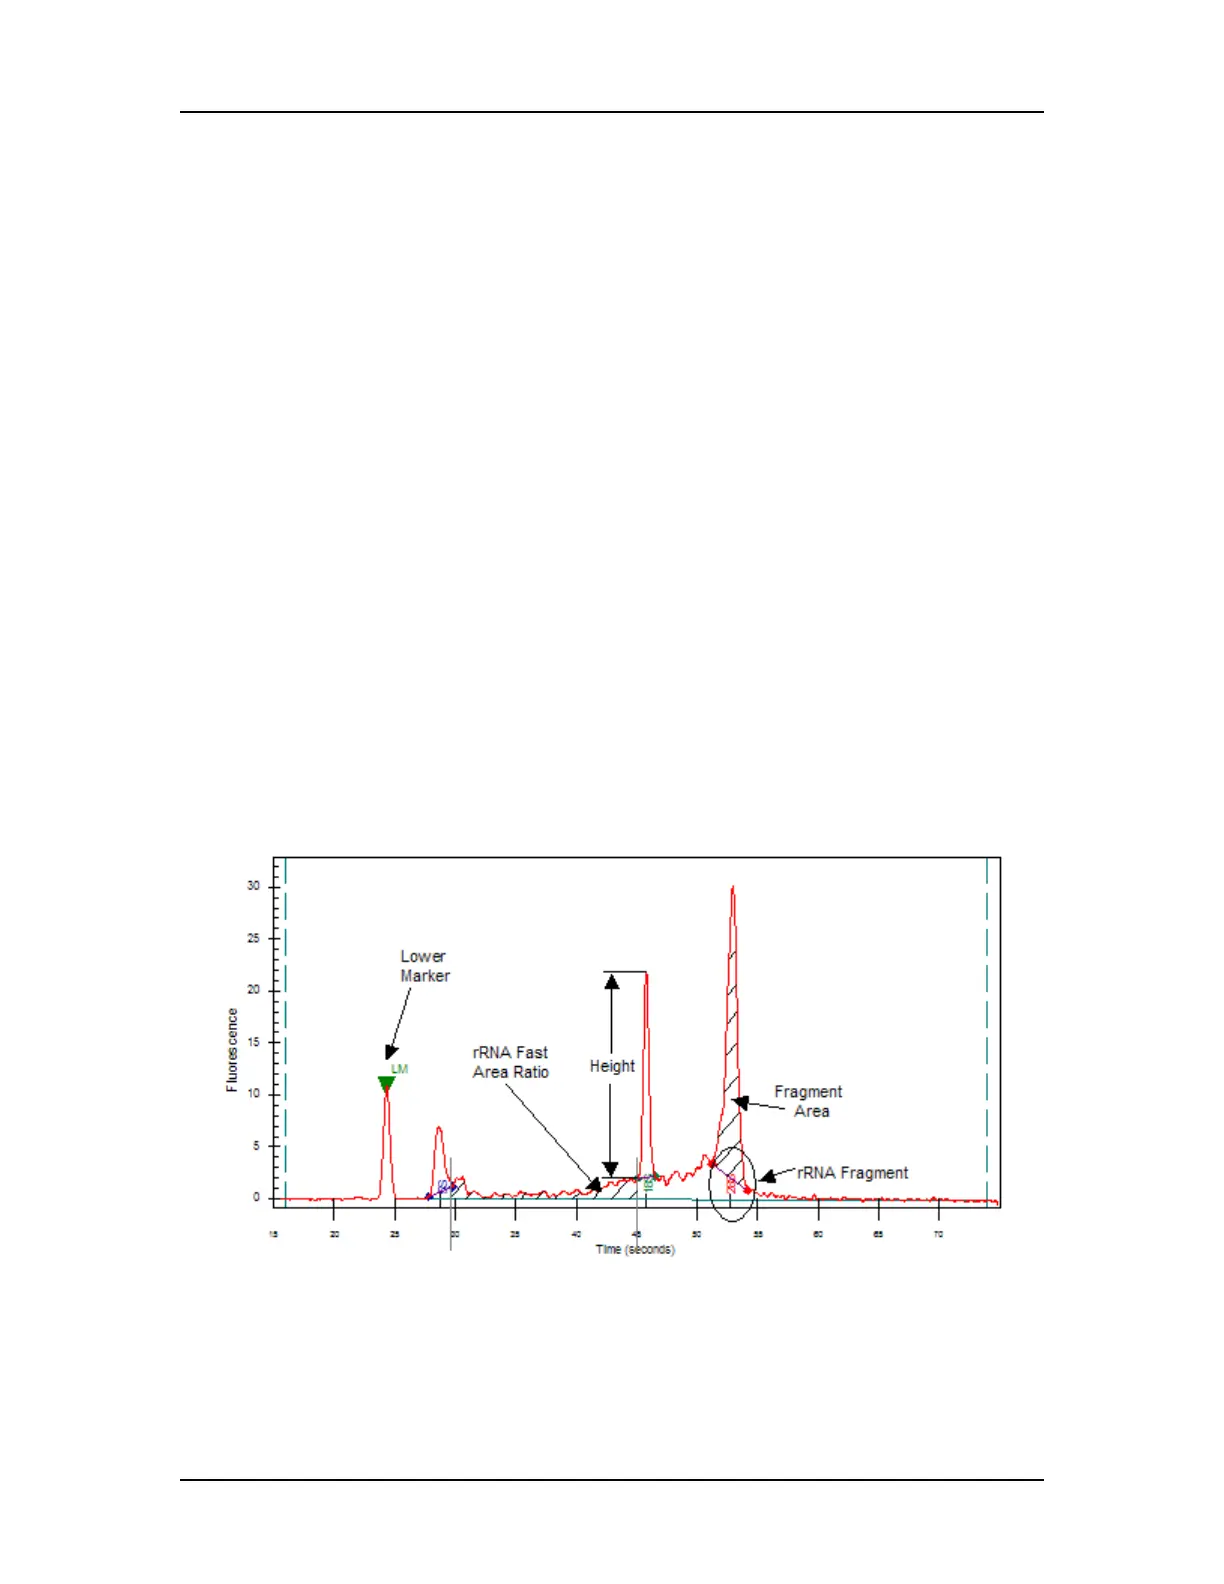
12 The following values are calculated for RNA assays:
Fragment_Area: Area of each rRNA Fragment.
%_of_Total_Area: Each Fragment area as a percent of total
area.
Corrected RNA Area: Total RNA Area corrected with Lower
Marker height.
RNA Concentration (ng/ul): Estimated Total RNA
Concentration in the sample.
rRNA Area Ratio [28S / 18S]: 28S area divided by 18S area.
rRNA Height Ratio [28S / 18S]: 28S height divided by 18S
height or 23S height divided by 16S height.
rRNA Fast Area Ratio: Region between 5S and 18S or 16S,
percent of total area.
RNA quality metrics: rRNA Area and Height Ratios (28S/18S
or 23S/16S) and Fast/Total RNA area ratio are computed.
Figure 18. rRNA Graph Analysis
13 Messenger RNA Assay: The RNA contamination ratio is
computed. This is the ratio of the area of all the fragments to
total RNA area.

 Loading...


