Data Analysis 52
V4.2 LabChip GX User Manual PerkinElmer
How the Software Analyzes RNA Data
(Continued)
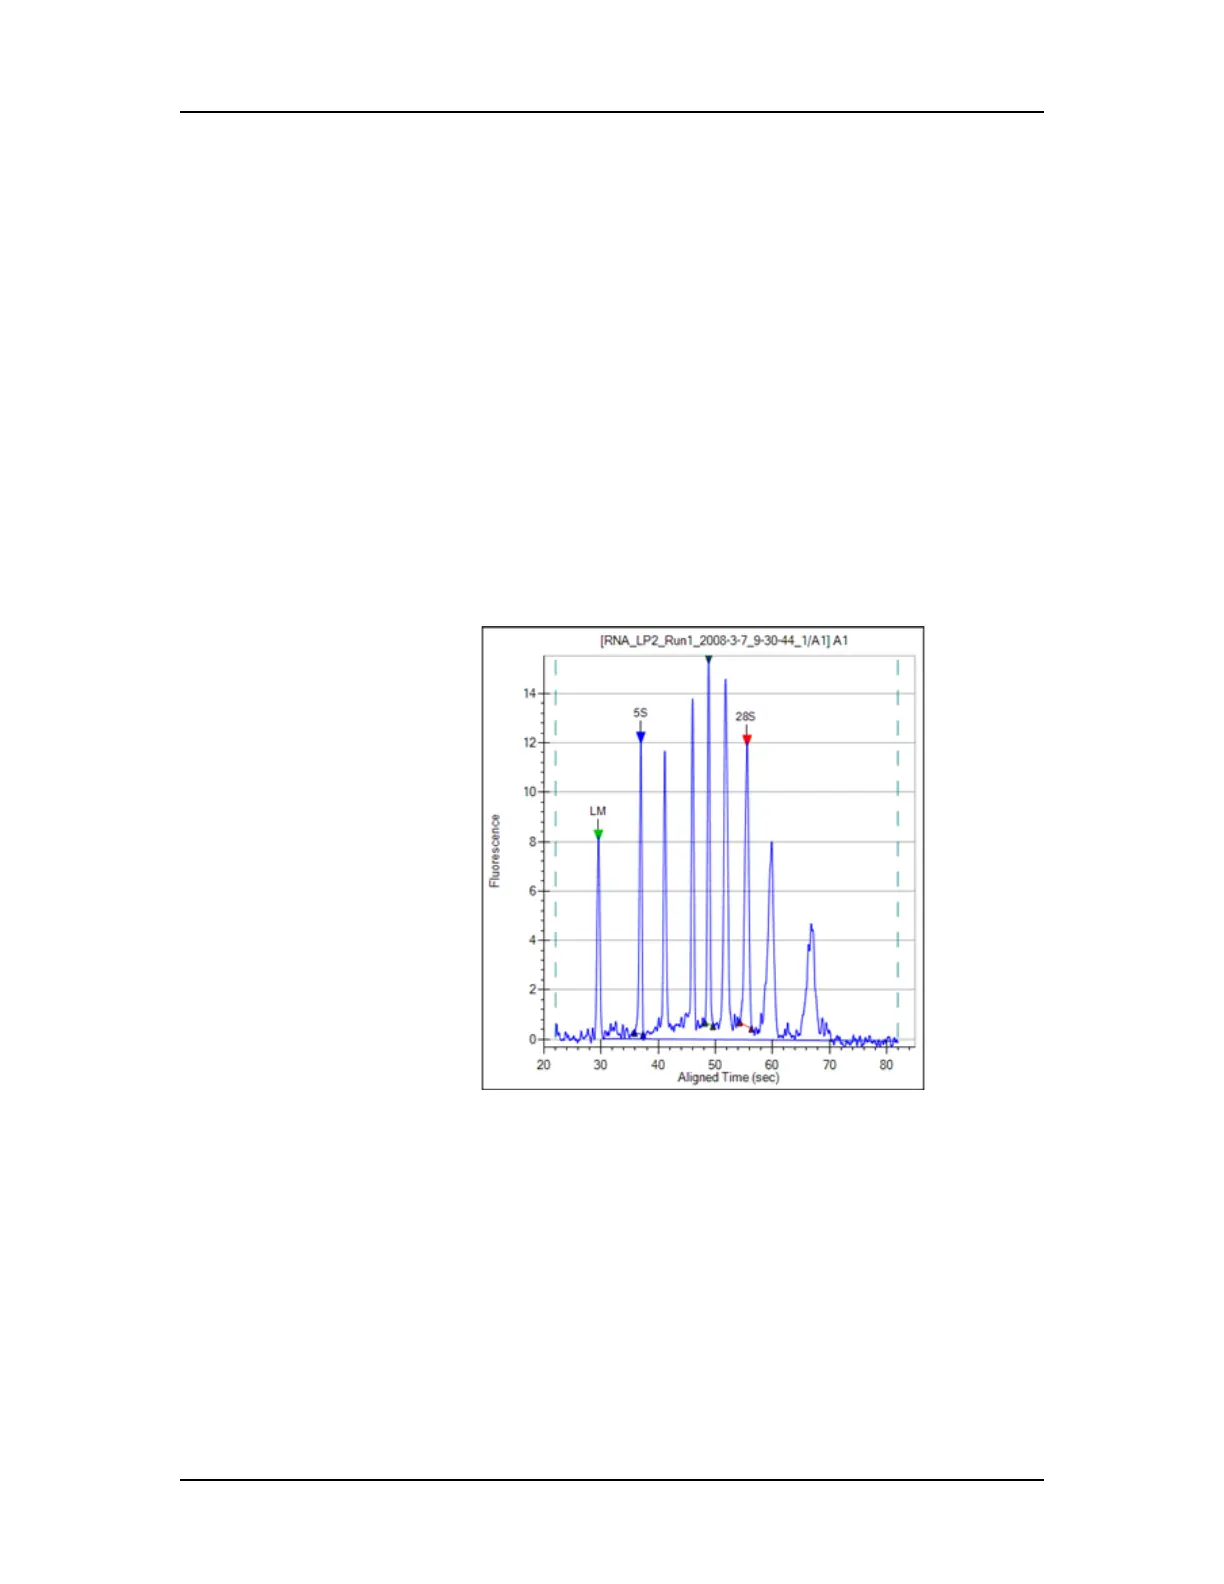
9 The Total RNA present is computed by finding the area under
the electropherogram trace. The baseline for this integration is a
straight line starting at the end of the lower marker and ending
at the baseline end time. The height of the baseline endpoints is
computed from an average of a five second window around the
baseline Start Time and End Time (shown on the Peak Find
Tab). View the baseline by selecting Show Peak Baselines in
the Graph View Properties. Adjust the Start Time and End Time
by dragging the left (Start) and right (End) vertical dashed lines
to areas that more properly reflect the signal baseline. (Right-
click in the graph, select Set Scale, and change the X axis
Minimum and Maximum values if the start and end times are not
shown in the graph.)
Figure 17. Peak Baseline - RNA
10 The Total RNA concentration in the sample is computed from
the ratio of the RNA area in the sample to the RNA area in the
ladder multiplied by the ladder concentration specified in the
assay.
If a titer is being used, the ladder is not used for quantization.
Instead, peak sample areas are normalized using the lower
marker and then quantization is performed using the titer
standard curve to convert normalized area to concentration; see
“Titer” on page 328.

 Loading...


