Glossary of Terms 327
V4.2 LabChip GX User Manual PerkinElmer
gDNA Assays
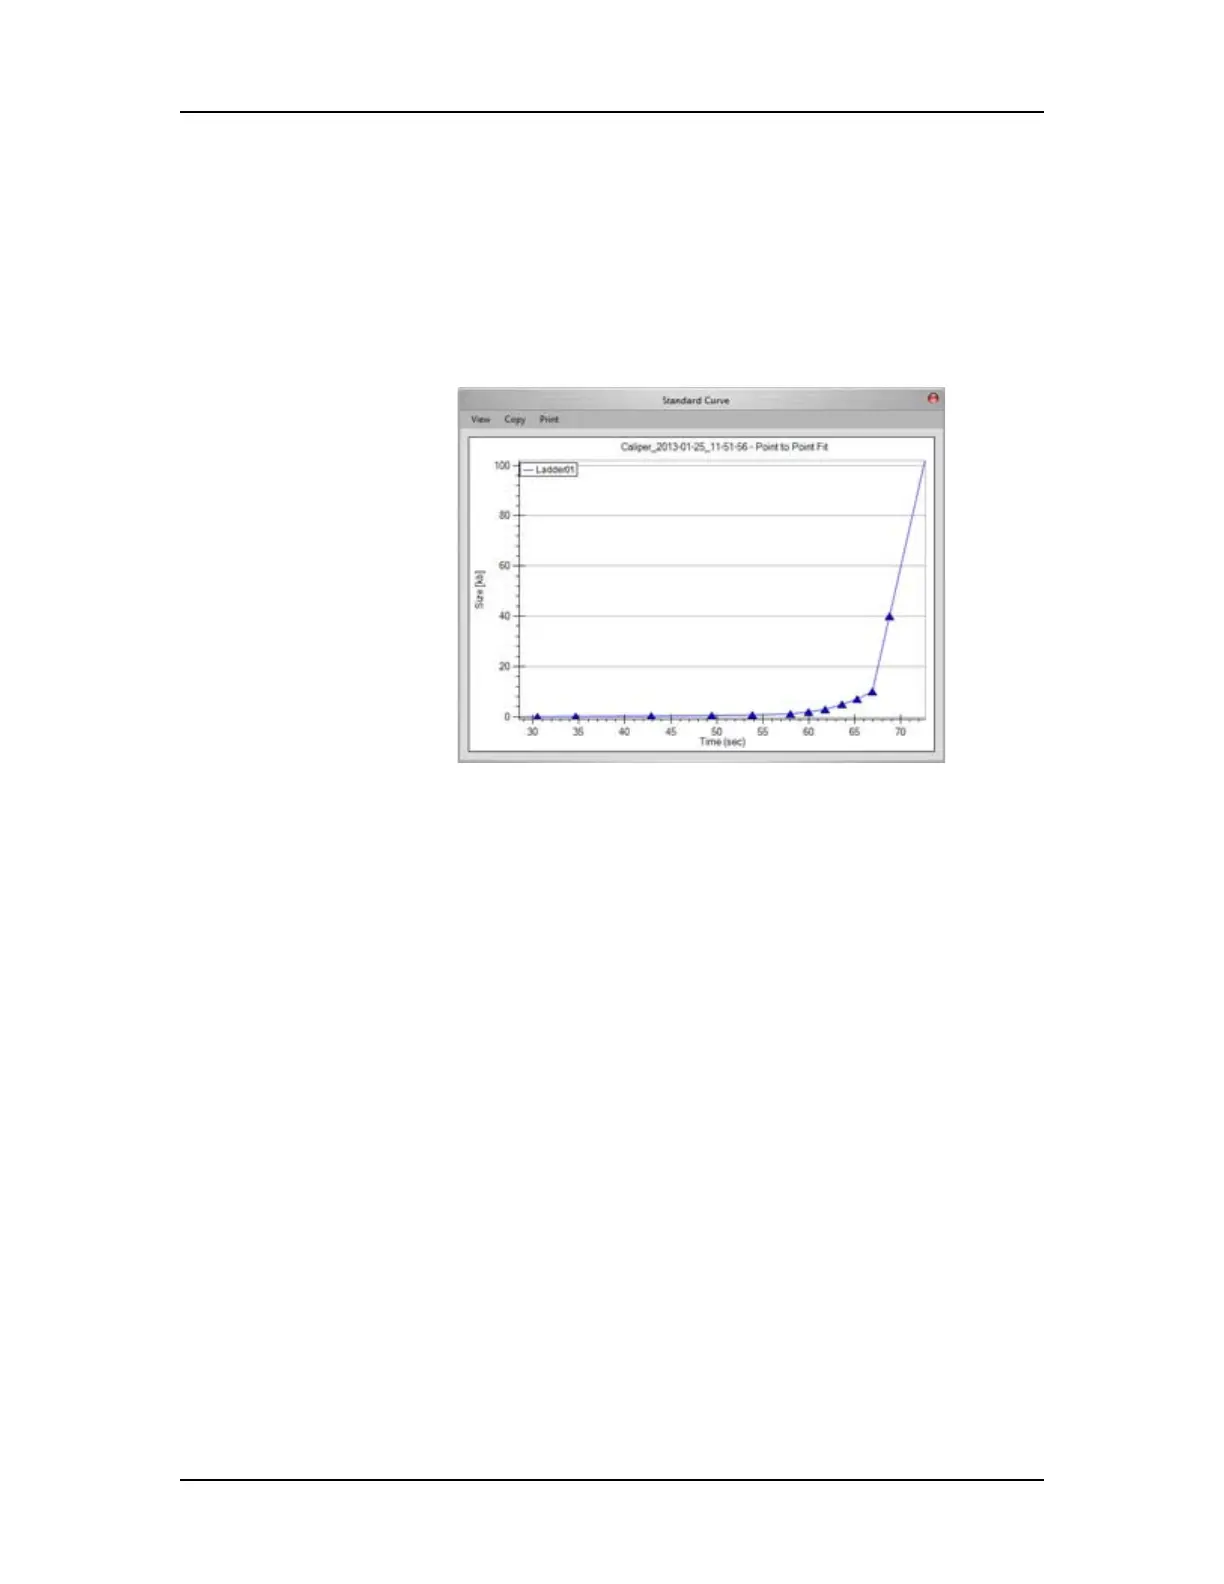
When you choose Standard Curve from the Analysis menu for a
gDNA assay, a window similar to Figure 150 opens. The standard
curve is drawn from the values obtained for the gDNA ladder. It is a
plot of the size of the ladder peaks vs. time with a point-to-point fit.
For each sample peak, the apex is interpolated from the Standard
Curve to determine the peak size in kb (kilo base pairs).
Figure 150. gDNA Assay Standard Curve
Start Point
The peak find algorithm analyzes the data from time zero looking
for a slope greater than the Slope Threshold. The point where the
slope is greater than the slope threshold specified in the Peak Find
Tab is marked as the start point of a peak.
Start Time
This setting determines the time after the start of a run when peaks
will be detected. Any peaks appearing before this time are ignored.

 Loading...


