Glossary of Terms 326
V4.2 LabChip GX User Manual PerkinElmer
Figure 148. Protein Assay Standard Curve
For more information about the use of the standard curve during
analysis, see “How the Software Analyzes Protein Data” on
page 45.
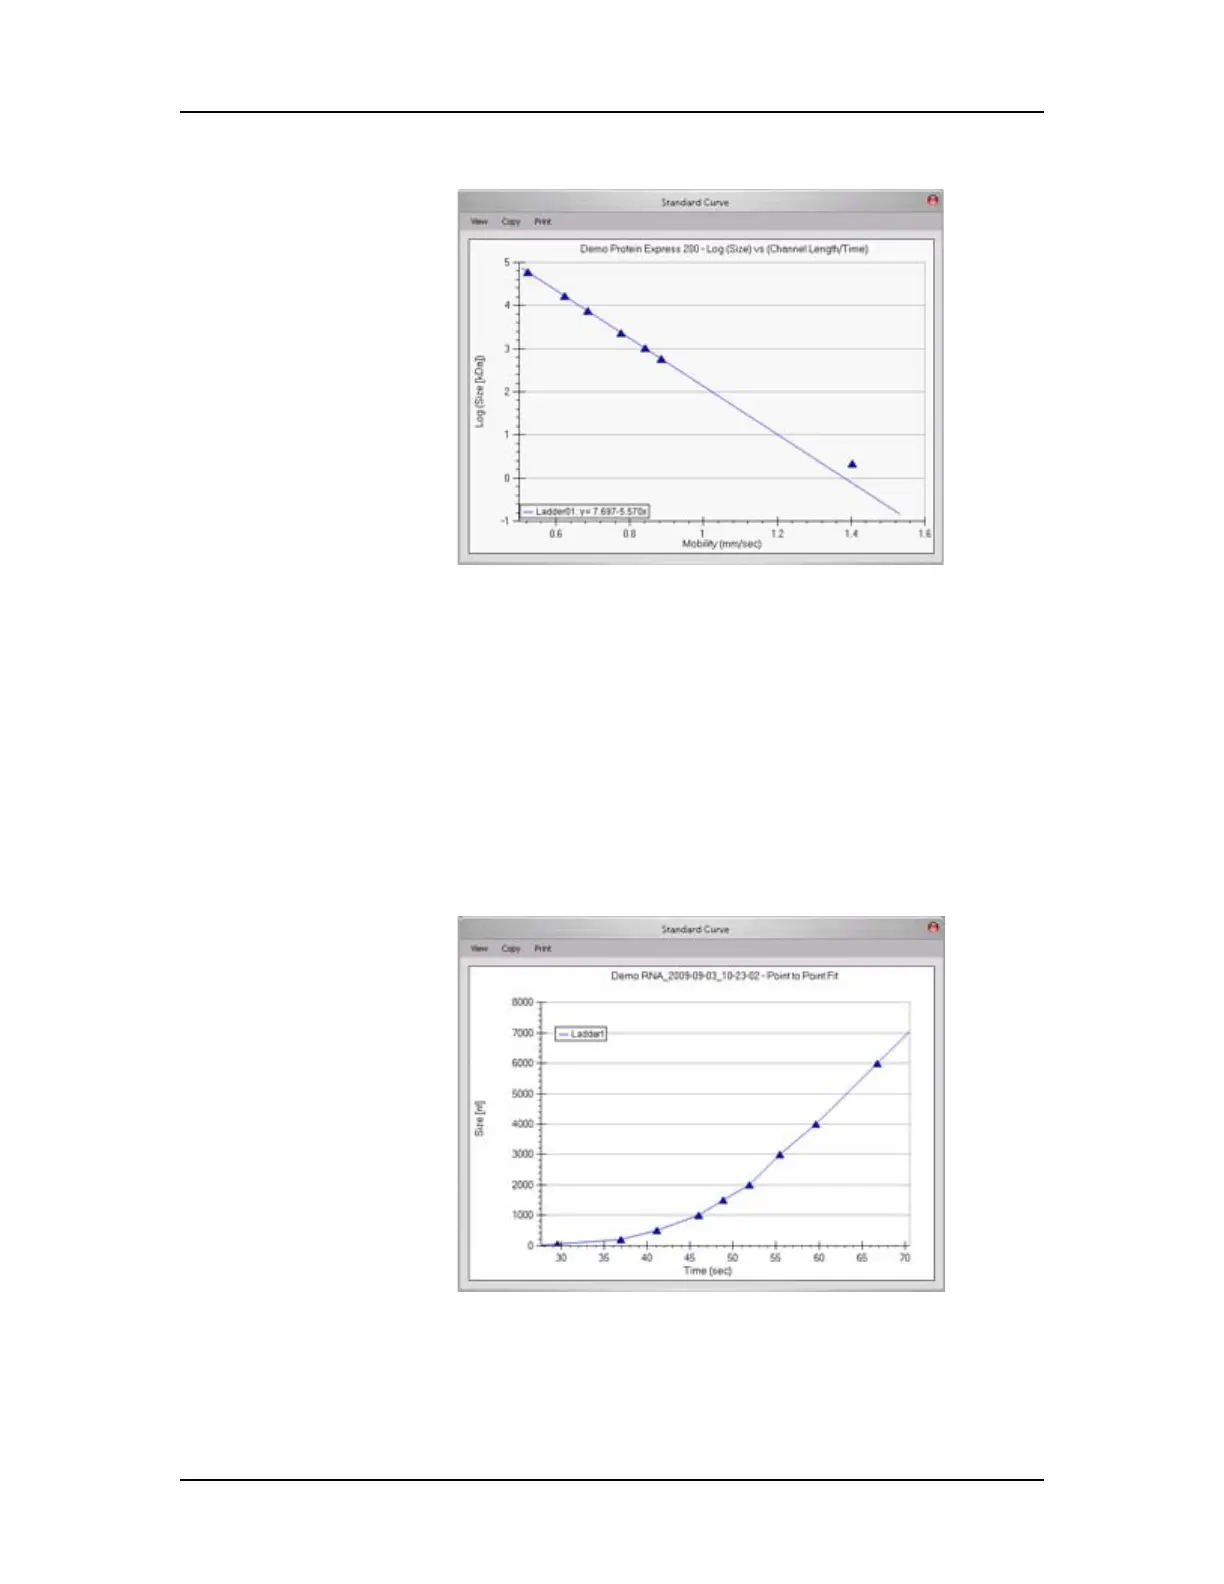
RNA Assays
When you choose Standard Curve from the Analysis menu for an
RNA assay, a window similar to Figure 149 opens. The standard
curve is drawn from the values obtained for the RNA ladder. It is a
plot of the size of the ladder peaks vs. time with a point-to-point fit.
For each sample peak, the apex is interpolated from the Standard
Curve to determine the peak size in nt.
Figure 149. RNA Assay Standard Curve
For more information about the use of the standard curve during
analysis, see “How the Software Analyzes RNA Data” on page 49.

 Loading...