Glossary of Terms 325
V4.2 LabChip GX User Manual PerkinElmer
Standard Curve Window
The Standard Curve window shows the Standard curve used for the
selected plate data. Each window displays the following menus:
View menu - Select or clear the ladders to display in the window.
Copy menu - Copies the current view to the clipboard.
Print menu - Displays the Print Preview or prints the Standard
Curve.
DNA Assays
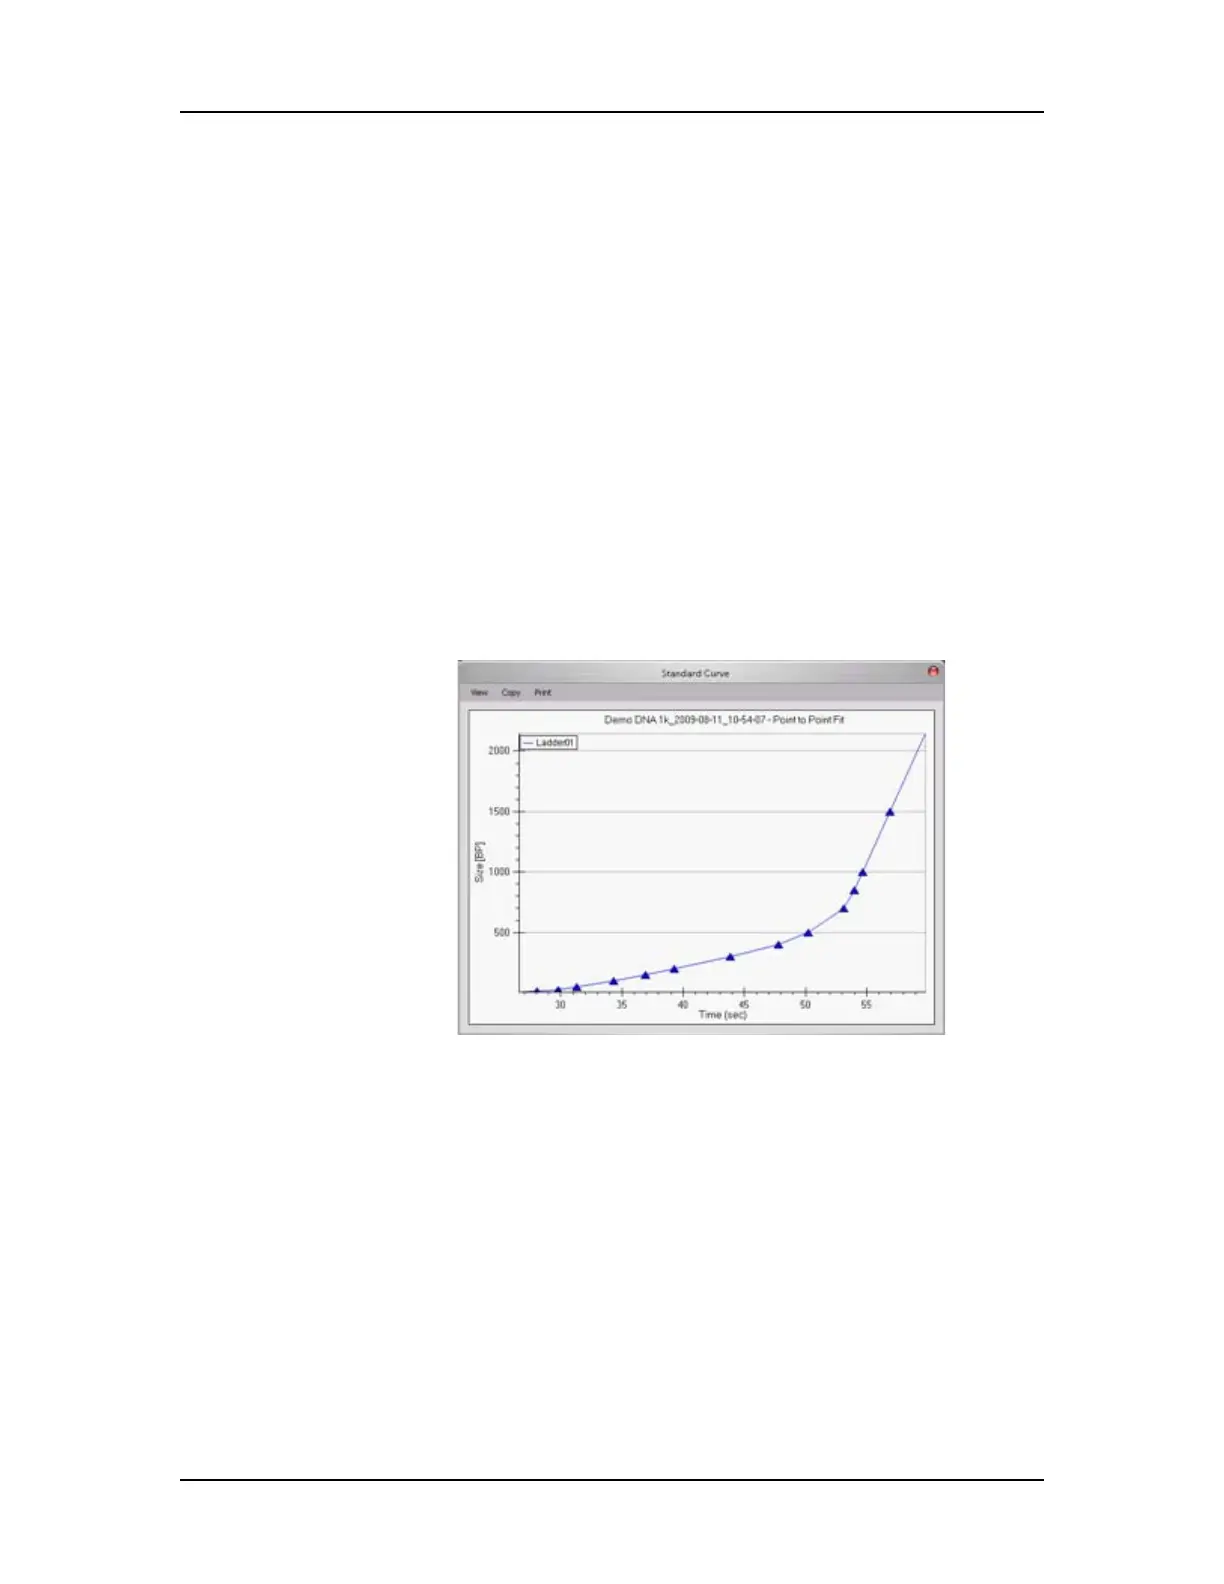
When you choose Standard Curve from the Analysis menu for a
DNA assay, a window similar to Figure 147 opens. The standard
curve is drawn from the values obtained for the DNA ladder. It is a
plot of the size of the ladder peaks vs. time with a point-to-point fit.
For each sample peak, the apex is interpolated from the Standard
Curve to determine the peak size in bp (base pairs).
Figure 147. DNA Assay Standard Curve
For more information about the use of the standard curve during
analysis, see “How the Software Analyzes DNA Data” on page 43.
Protein Assays
When you choose Standard Curve from the Analysis menu for a
Protein assay, a window similar to Figure 148 opens. The standard
curve is drawn from the values obtained for the protein ladder. It is a
plot of the size of the ladder peaks vs. time with a Log fit. For each
sample peak, the apex is interpolated from the Standard Curve to
determine the peak size in kDa (kiloDaltons).

 Loading...


