X35 Console Overview
2.15
4. (D) Area Counters panel - for detailed
information refer to Section 2.6.5 - Area
Counters
Panel.
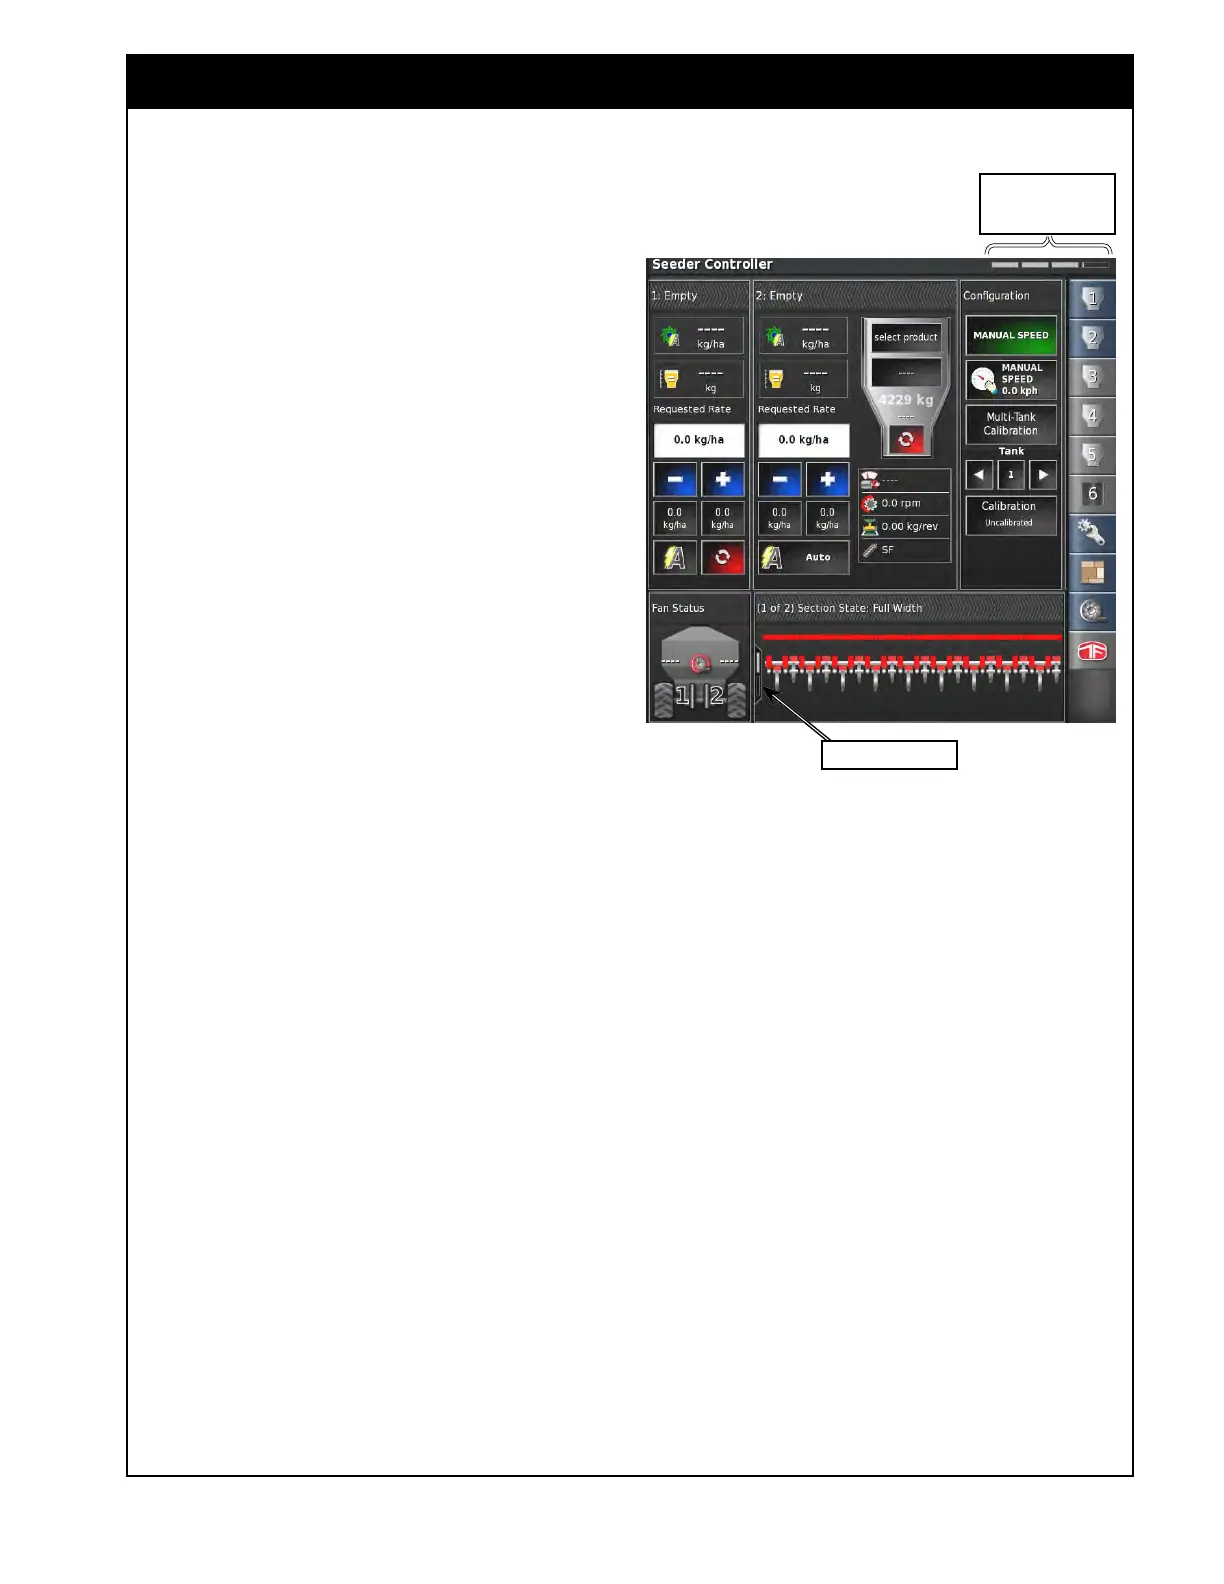
5. (E)
Fan Status panel toggle - this icon works
like a toggle switch, making the Fan Status
panel (F) visible or not.
6. (F)
Fan Status panel - displays fan(s) speed
for enabled fan(s), for a disabled fan it will
show "----" in place of a fan speed.
7. (G)
Monitoring panel - includes multiple
windows to display and control the section
state for the configured booms as well as the
blockage monitoring state, the drill control
parameters and the brake control parameters
depending on the features that are enabled.
a. The title bar lists which window is
displayed and how many windows are
available along with the slider bar on the
left.
i.
To switch windows touch in the
panel and slide up or down.
b. If the unit is configured with multiple
booms, the section state window will list
which one is displayed.
i. They can be toggled by touching on
the boom and sliding up or down
depending on the position of the
other boom.
Note
To slide to the next window when the section state
window is displayed, touch on the very top or very
bottom of the window and slide up or down.
c. To expand the monitoring panel touch
on the title bar. It can be scrolled over
to view the fan panel by touching on the
window and sliding left and right.
i. Touch the title bar again to minimize
the monitoring panel.
8. (H)
Drill Fold panel - functions to control
the 3420 drill only. Refer to the 3420 PHD
Operator's Manual.
Figure 2.22 - Section State Panel
Viewing area position
status bar
Slider Status Bar