EasyManuals Logo

PerkinElmer LabChip GX User Manual

PerkinElmer LabChip GX
346 pages
To Next Page IconTo Next Page
To Previous Page IconTo Previous Page
Page #50 background imageLoading...
Page #50 background image
Data Analysis 50
V4.2 LabChip GX User Manual PerkinElmer
How the Software Analyzes RNA Data
(Continued)
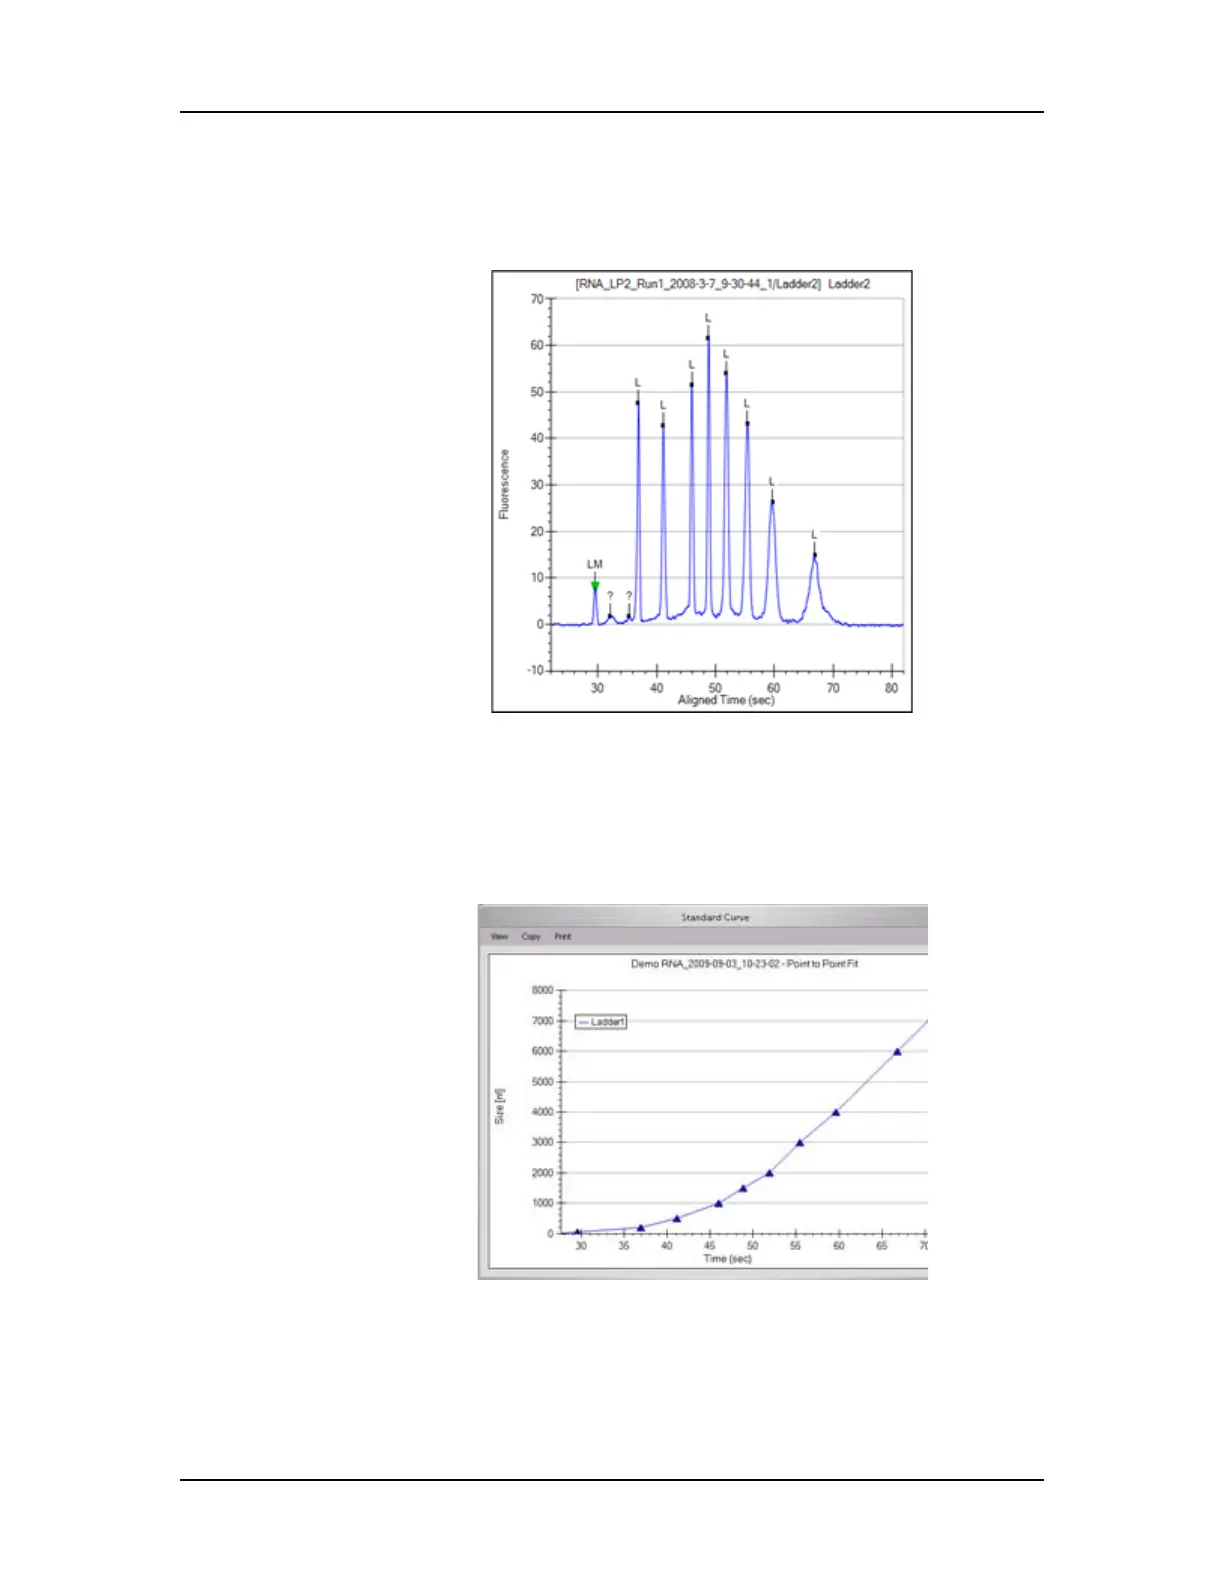
Figure 14. Ladder Graph - RNA
6 The ladder is analyzed (see “Ladder Analysis” on page 311) and
a standard curve of migration time versus RNA size is plotted
from the RNA ladder by interpolation between individual RNA
fragment size/migration points. The standard curve derived from
the data of the ladder well should resemble Figure 15.
Figure 15. Standard Curve - RNA

Table of Contents

Questions and Answers:

Question and Answer IconNeed help?

Do you have a question about the PerkinElmer LabChip GX and is the answer not in the manual?

PerkinElmer LabChip GX Specifications

General IconGeneral
BrandPerkinElmer
ModelLabChip GX
CategoryMeasuring Instruments
LanguageEnglish

Related product manuals