6.63
Date Code 20171021 Instruction Manual SEL-421 Relay
Protection Applications Examples
345 kV Tapped Overhead Transmission Line Example
The SEL-421 at Station T measures the largest apparent fault impedance for
faults at Station R because the source at Station S is stronger than the source at
Station R. Therefore, Zone 2 at Station T must be set to 115.86 primary (plus a
safety margin) so that the relay can detect faults at Station R when the source at
Station S is in-service; this is the largest Zone 2 reach.
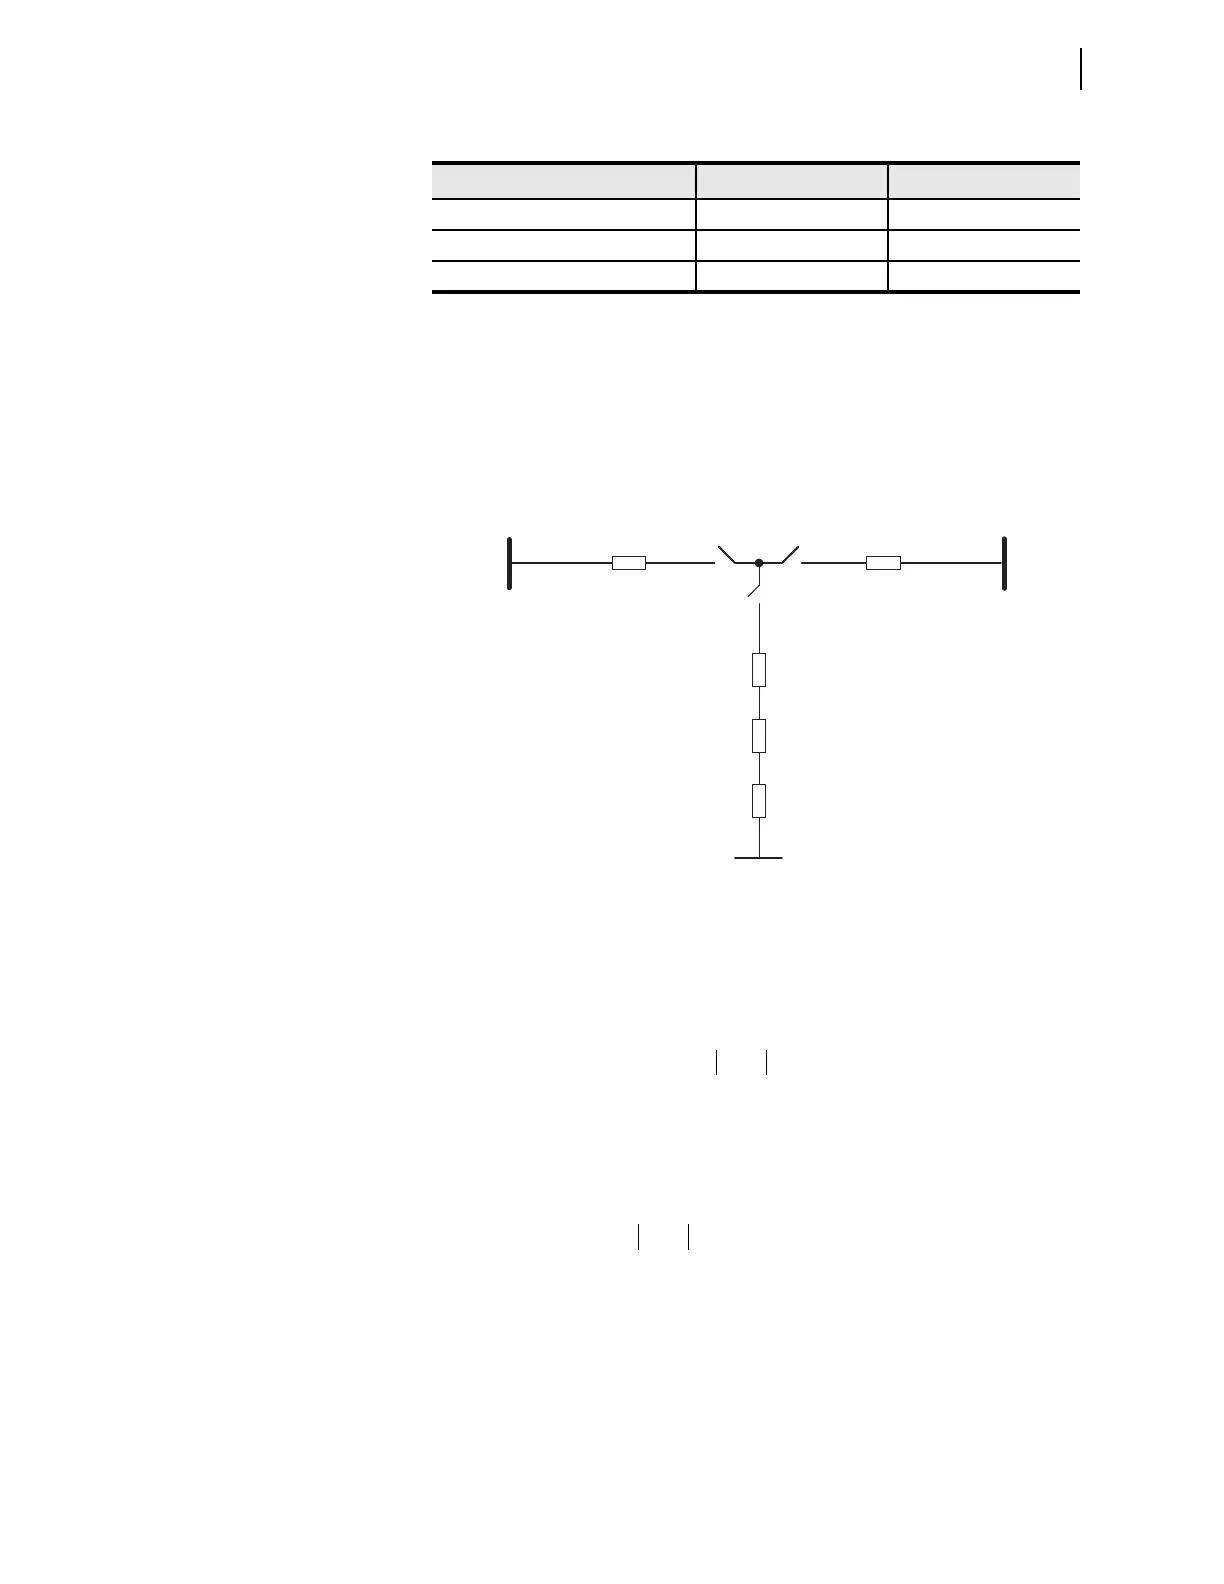
Figure 6.14 is an impedance diagram of the 345 kV tapped overhead transmis-
sion line; only the reactances (per unit) are shown.
To determine the greatest amount of overreach from a remote terminal during
reverse faults with respect to Station S, subtract the fault impedance from the cor-
responding apparent impedance measurement from Table 6.18.
Calculate the overreach at Station R (SW-B open; SW-L and SW-R closed).
Equation 6.28
Calculate the overreach at Station T (SW-R open; SW-L and SW-B closed).
Equation 6.29
Table 6.18 Apparent Impedance Measurement for Remote Faults
Station |ZAG| |ZBC|
Relay at Station R, Fault at Station T 152.7 (0.128 per unit) 196.65 (0.165 per unit)
Relay at Station T, Fault at Station S 79.605 (0.418 per unit) 76.845 (0.404 per unit)
Relay at Station T, Fault at Station R 103.86 (0.545 per unit) 115.86 (0.608 per unit)
Figure 6.14 Impedance Diagram
0.0248
X
1L1
X
1L2
SW-L SW-R
SW-B
X
1L3
X
H
X
M
0.0372
0.108
-0.092
T
0.0248
SR
Overreach Z
APP
X
1L1
– X
1L2
–=
0.165 0.0248– 0.0248–=
0.115 per-unit=
Overreach Z
APP
X
M
– X
H
X
1L3
X
1L1
–––=
0.608 0.092–– 0.108 0.0372– 0.0248––=
0.53 per-unit=