X35 Console Monitoring & Managing Files
10.6
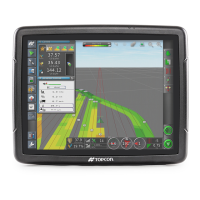
Figure 10.7 - Job Statistics Select Data List
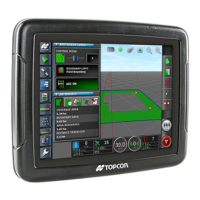
Refer to Figure 10.9. This figure shows an
example of the Dashboard with Speed, Heading,
Cross Track Error and Swath selected for display
from the Customize Dashboard menu.
Speed, Heading, Cross Track Error or Swath
panels can be customized to display up to three
items, when selected. The Select Data menu will
appear, refer to Figure 10.7.
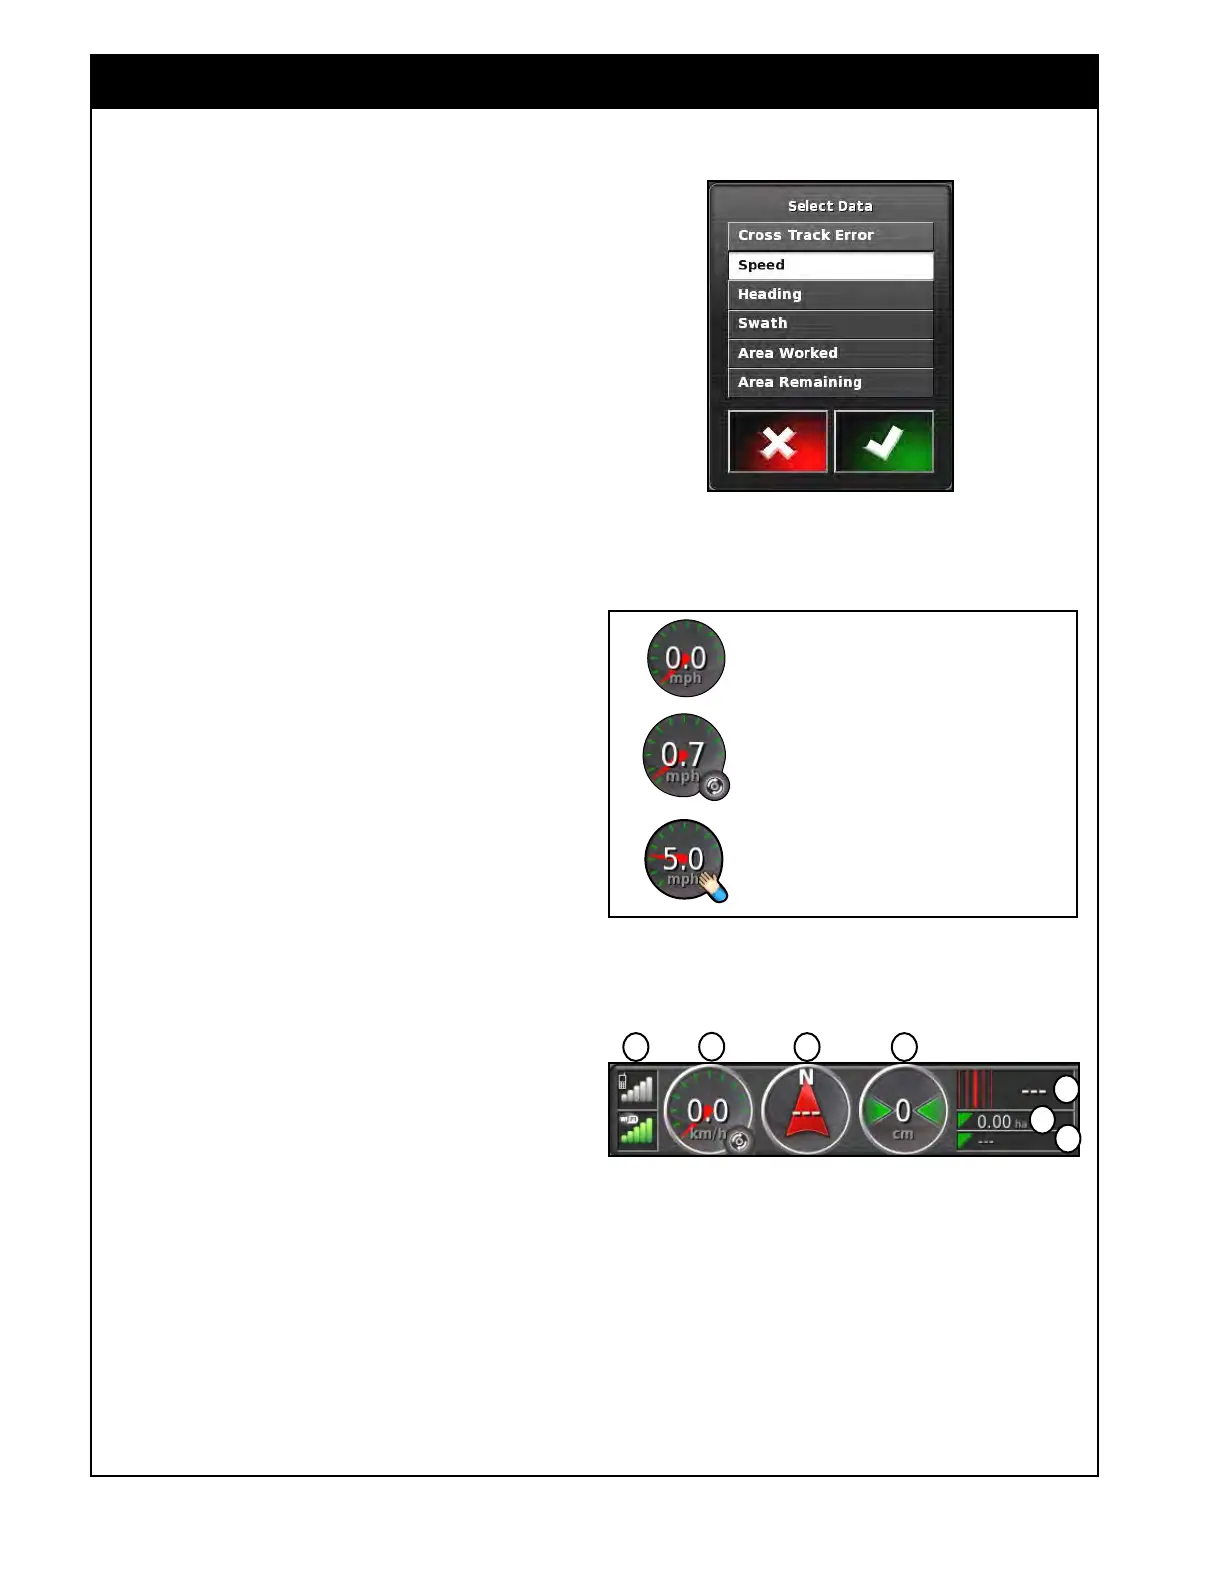
7. Speed
Panel (F) - displays the ground speed
of your vehicle (tractor)/seeding implement.
a. The symbol in the right lower corner of
the speed panel indicates the speed source,
refer to Figure 10.8.
8. Heading
(G) - displays the direction of travel.
9. Cr
oss Track Error (H) - displays the distance
of the vehicle (tractor) from the nearest
wayline (if applicable).
10. Swath
(I) - displays the swath or wayline
being travelled (if applicable).
11. Area Worked (J) - displays the area that the
boom has covered including any overlapped
area and is based on GPS painted area.
a. Displays the value for the current boom
displayed on the guidance screen.
Note
For a more representative total area that product
is applied over, see the Treated Area under the
Area Counter for each tank. Refer to Section
2.6.5 - Area Counters Panel.
12. Area Remaining (K) - displays the remaining
area.
a. The value is the area within the boundary
minus the area covered.
b. Only appears once a field boundary is
created.
13. Signal
Strengths (L) - will display the signal
strength if wireless features are enabled.
Figure 10.9 - Speed, Heading, Cross Track Error and
Swath
I
G
J
H
K
Speed Source - GPS
Speed Source - Wheel
Speed Source - Manual
Figure 10.8 - Speed Source Indicator
F
L