Monitor
Except on the first page, right running head:
Heading1 or Heading1NewPage text (automatic)
315
Alcatel-Lucent
Beta Beta
OmniAccess 5740 Unified Services Gateway Web GUI Users Guide
TO VIEW GRAPHICAL REPRESENTATION OF INTERFACE STATISTICS
Follow the procedure given below to view the statistics of a selected interface in a
graphical representation:
Note: The statistics graph is shown only for active and administratively up interfaces only.
1. In the Interfaces page, click Real Time Graph icon in the Action column against
the interface whose statistics are to be viewed.
2. The graphical representation of the interface statistics is displayed in a pop up
window as shown below:
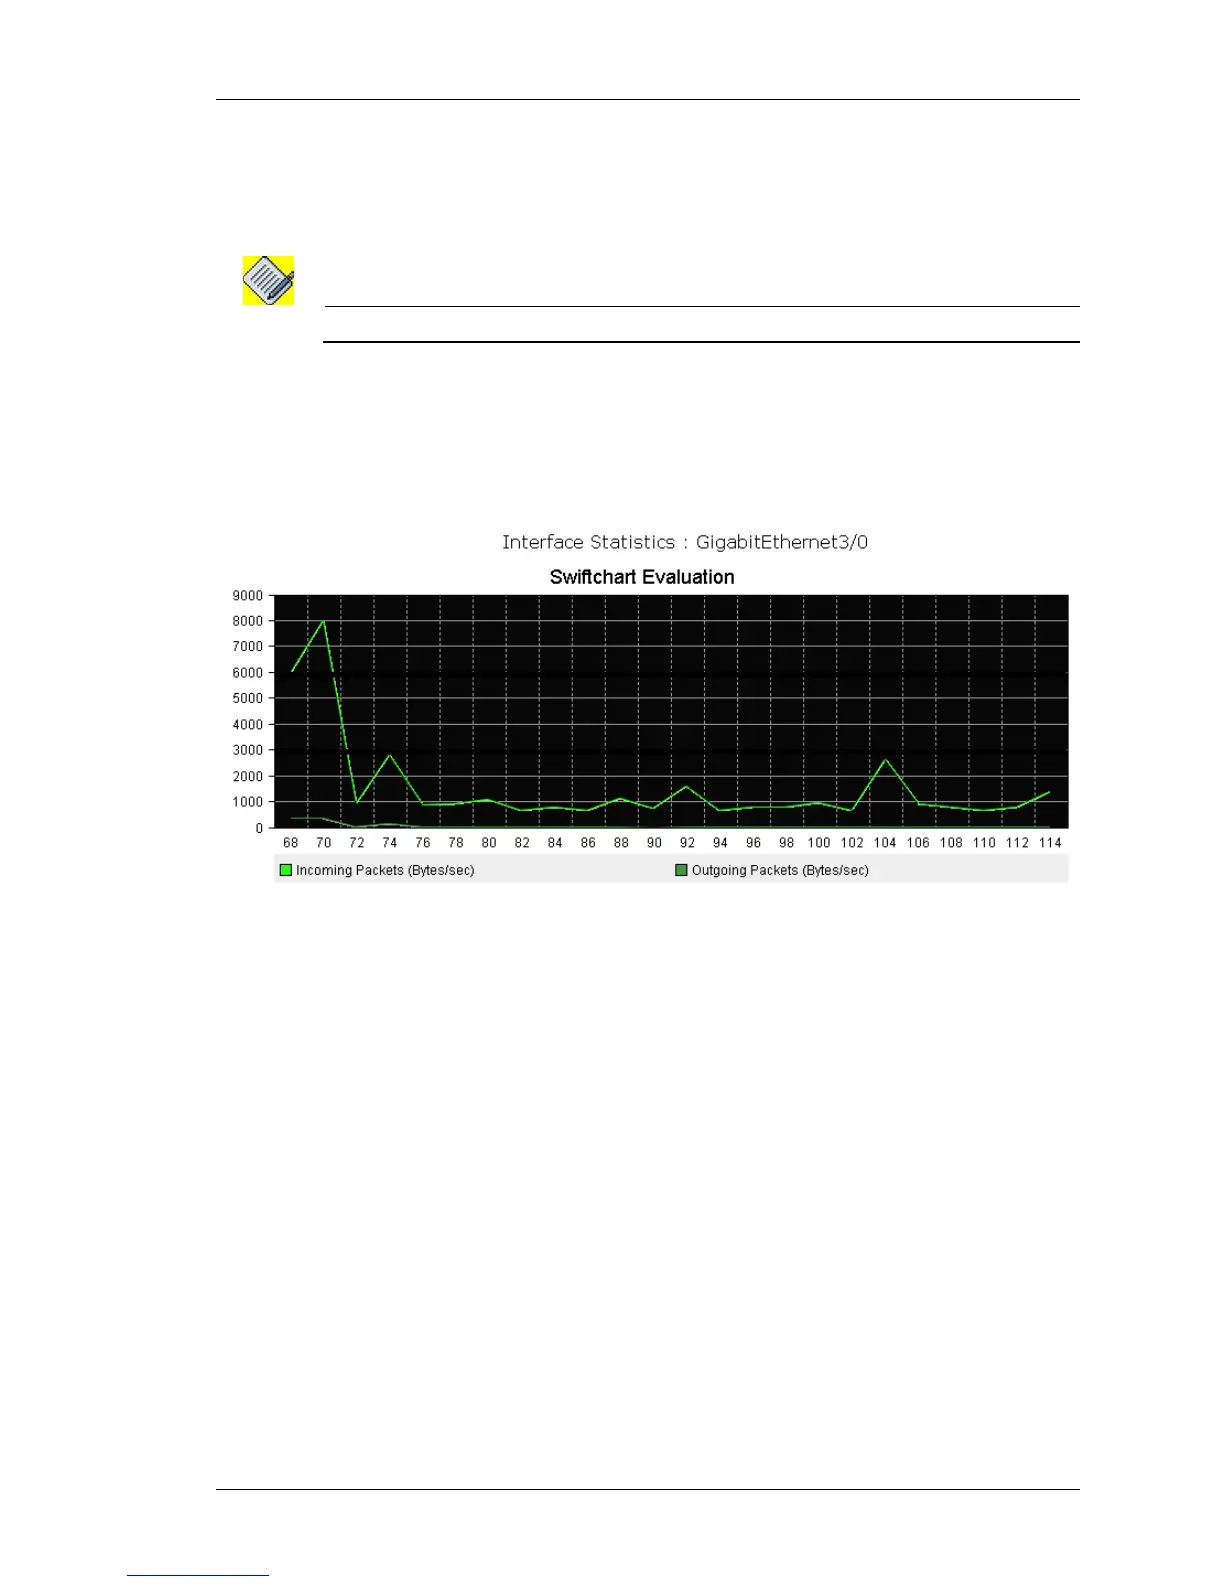
Figure 209: Monitor: Interfaces Statistics - View Interface Statistics
3. The graph shows the real time statistical details -the number of packets sent and
received on an interface (Bytes/sec).