Glossary of Terms 322
V4.2 LabChip GX User Manual PerkinElmer
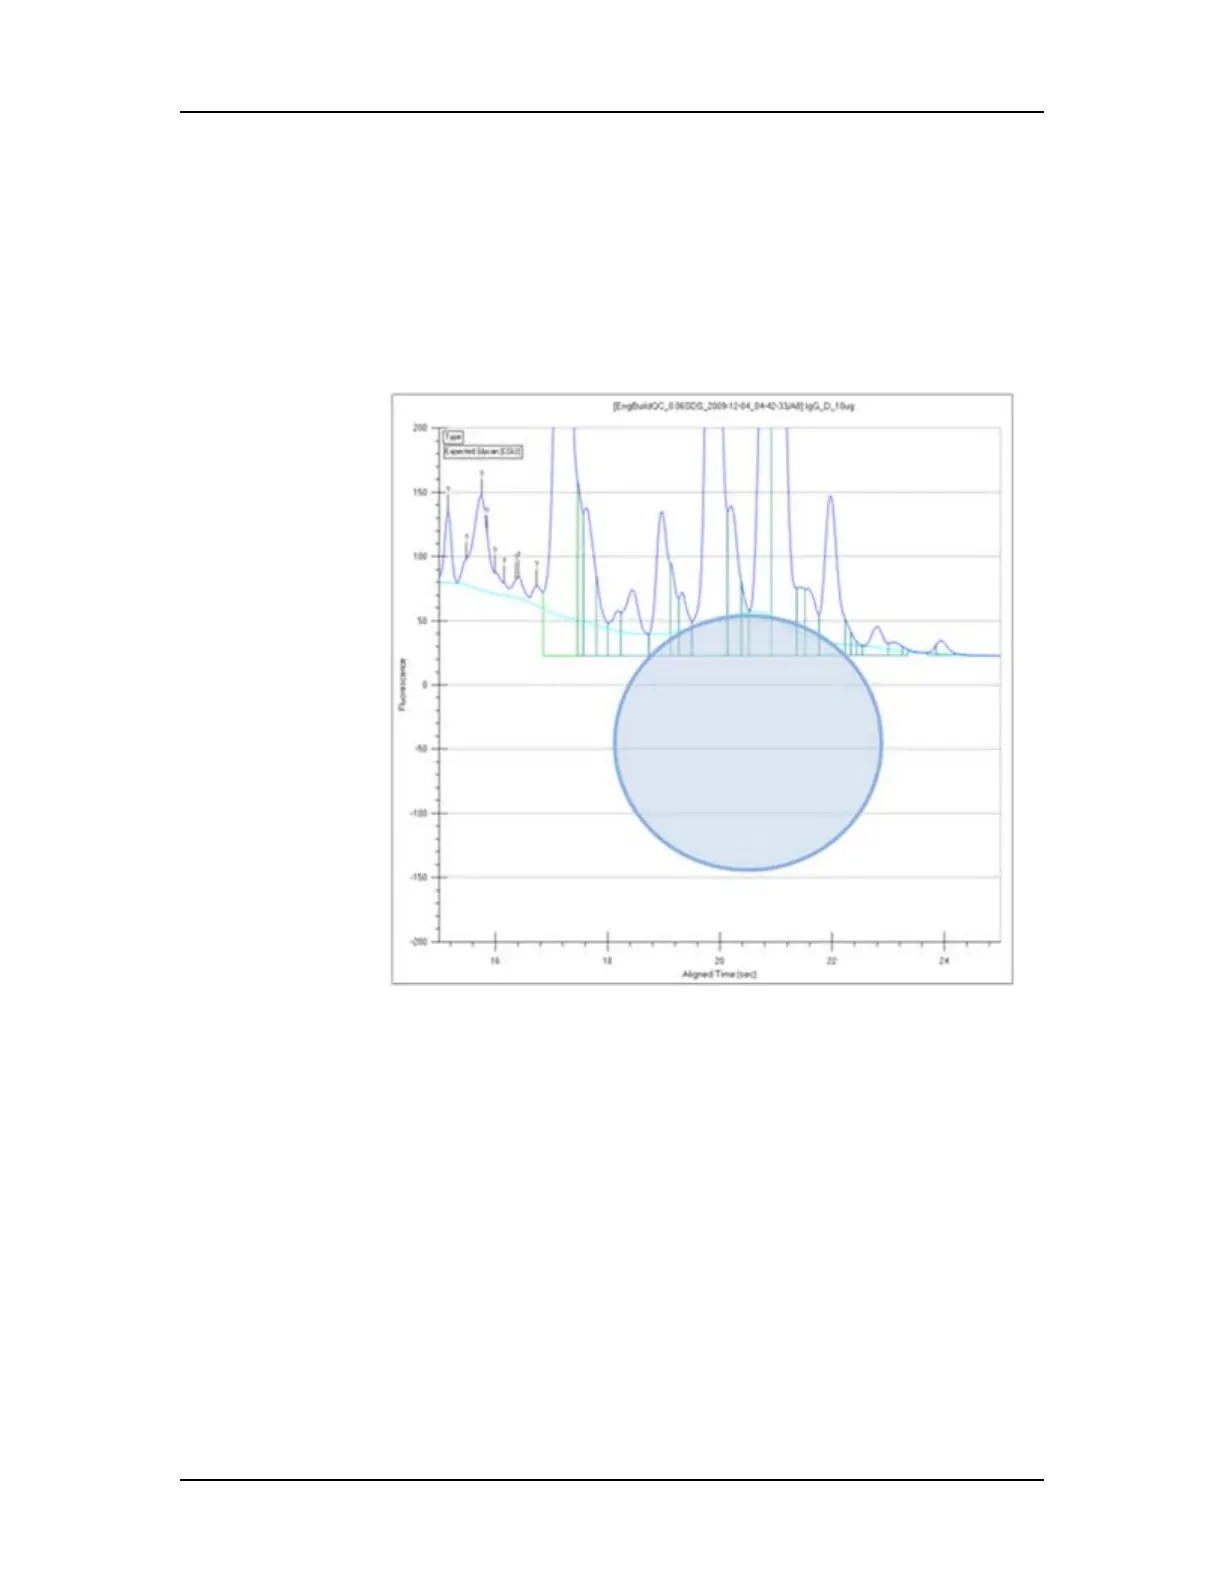
Rolling Ball Baseline Curve Example
The figures below show the effect of changing the size of the ball
when using the Rolling Ball Baseline Curve.
Figure 145 shows a baseline (the light blue line) generated by a ball
with settings of Time Diameter = 5 sec and Signal Diameter = 100
RFU.
Figure 145. Rolling Ball - 5 Sec x 200 RFU
Figure 146 on page 323 shows a baseline (the light blue line)
generated by a ball with settings of Time Diameter = 10 sec and
Signal Diameter = 200 RFU. The baseline curve does not follow the
signal as closely because the ball is larger. Increasing the ball size
generates a smoother baseline.
Either ball dimension can be used to increase the smoothness of
the curve, but increasing the Time Diameter increases the
computation time required to compute the curve, while increasing
the RFU Diameter does not.

 Loading...


