7. Type “O” [ENTER] to download the oscillography record from the RFL 9300 oscillography board to the
PC or laptop.
8. Click on “TRANSFERS”.
9. Click on “CAPTURE TEXT”.
10. Enter a new filename using the following format: XXXX.TXT. For example you can name the file
OSC1.TXT. Then press the [ENTER] key.
11. You will be prompted to enter a record number. Enter record number 1, and then press the [ENTER]
key. The oscillography data table will be displayed as shown in Figure 6-15.
12. Click on “TRANSFERS”.
13. Click on “CAPTURE TEXT”.
14. Click on “STOP” after the record is complete.
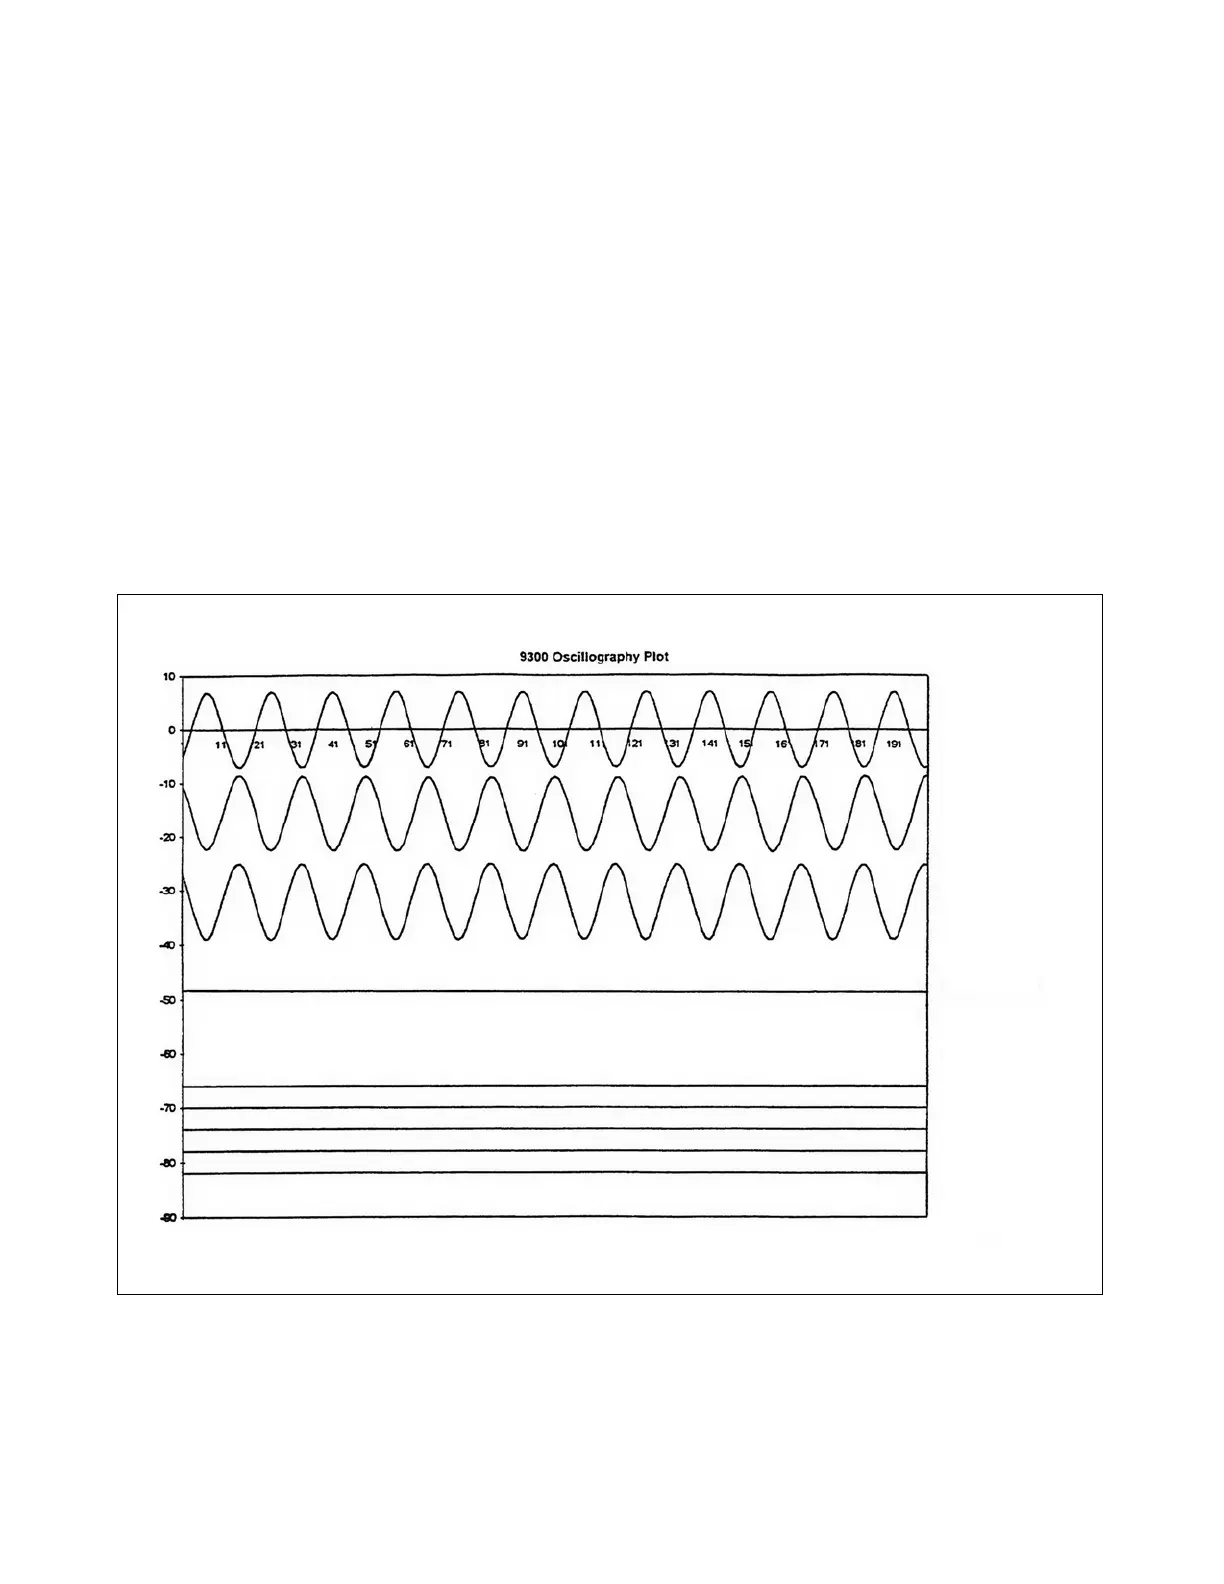
The oscillography record can be graphed using Microsoft Excel. A diskette containing a Microsoft Excel macro
is provided by RFL to perform this task. The diskette also contains a file with instructions on how to use the
Microsoft Excel macro under the filename README.TXT. The oscillography test data plot is shown below in
Figure 7-20.
----- Phase A
----- Phase B
----- Phase C
----- 3IO
----- A trip
----- B trip
----- C trip
----- 3IO trip
----- DTT
Figure 7-13. Oscillography Test data plot
The laboratory acceptance tests are now completed.
RFL 9300 RFL Electronics Inc.
October 20, 2004 7 - 22 (973) 334-3100