GE
P
ART NUMBER FN091065, REVISION 2 VS5 N AND VS6 N SERVICE MANUAL
7-68 Section 7-4 - Performing Front End (FE) Diagnostics
PRELIMINARY
7-4-6 Probe Select Board Diagnostic Tests (cont’d)
NOTE: The ACW Matrix Test test has three test reports (Signal Frequency, Signal RMS, and Signal
SNR) which are listed in the Reports window on the right. By default, the Signal Frequency
report is displayed in the Reports window below (Figure 7-39 "View Test Log - ACW Matrix Test
- Signal Frequency" on page 7-67).
NOTE: Left and right arrows provided in the View Report window enable scrolling between the different
channels.
Left-clicking on a currently-selected channel marks a red square on the report graph, and also evokes
the display of the following information relative to that specific point: Average, Deviation (standard
deviation from the Average), Max, and Min.
The signal should be within the limits marked in the white area (the dotted line represents the Average),
as shown in Figure 7-39 "View Test Log - ACW Matrix Test - Signal Frequency" on page 7-67.
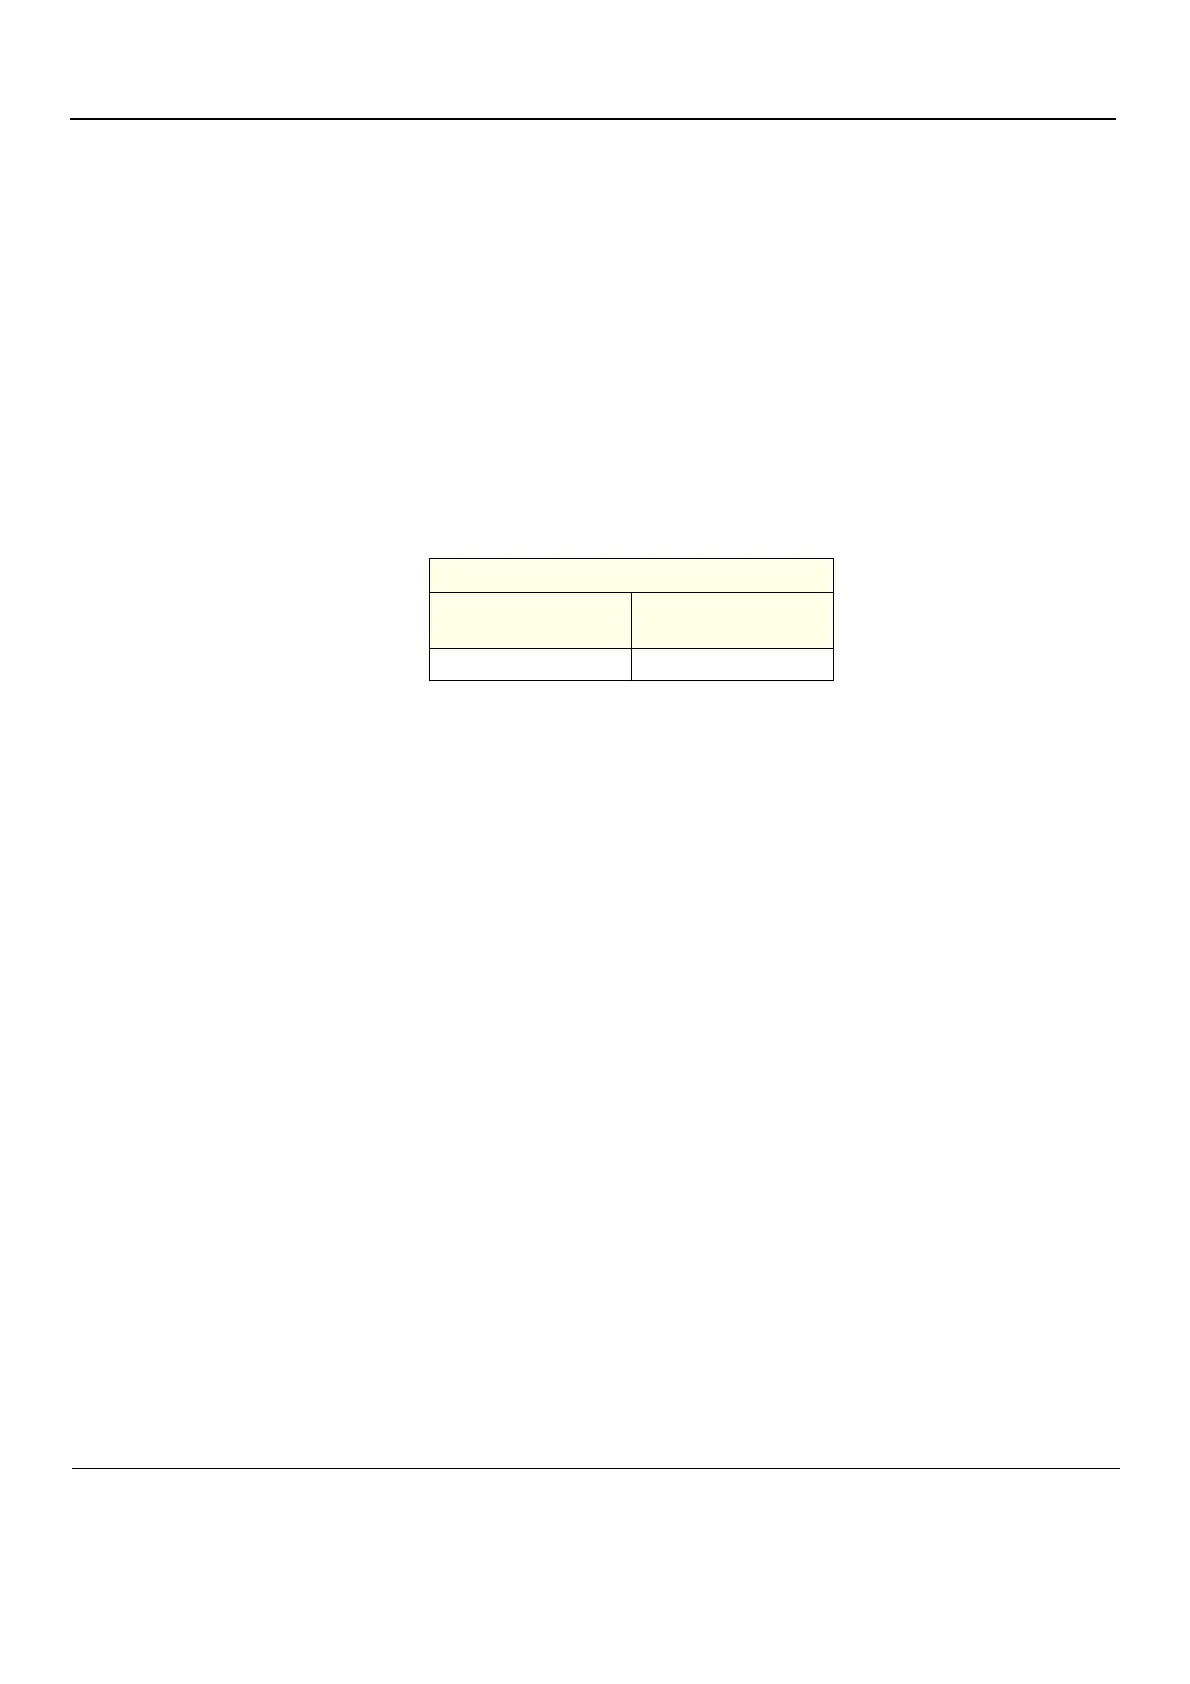
If the test fails, check the results manually in accordance with Signal SNR limits shown in Table 7-4:
7) When done, trackball to the Close button and press Set to close the View Report window.
Table 7-4 ACW Matrix Test - Signal SNR Limits
Signal SNR
Lower Limit
dB
Upper Limit
dB
43.0 55.0
 Loading...